


Decoding Financial Statements
An Operational Point Of View

Merry Christmas and Happy New Year, everyone! 🎉 Can you believe we’ve been hanging out on this platform for almost four months now? Time really does fly when you’re having fun! With the holidays still in full swing—and let’s be honest, many of us still recovering from those big Christmas dinners—we thought we’d handle a more fundamental topic.
Now, judging by the title, you might’ve already guessed our topic: financial statements. Before you yawn, hear me out—this isn’t just about numbers. Financial statements are like a company’s autobiography. They tell the story of its struggles, triumphs, and everything in between. If you know how to read them, they can reveal a lot about what’s really going on under the hood. But—and this is a big but—they don’t tell you everything. Numbers can be powerful, but they can also be misleading if you don’t know where to look.
That’s why we’re splitting this topic into two parts. Today’s article (Part I) will focus on the operational side of things. We’ll dive into the income statement and start unpacking the cash flow statement. Then, in Part II, we’ll explore the financial side, including the balance sheet and the rest of the cash flow statement.
So, grab a cup of coffee (or maybe some leftover Christmas cookies), get comfy, and let’s dive in!
Income Statement
The end of the year marks a busy time for many companies—it’s when fiscal years wrap up and annual reports start taking shape. The same goes for our (still fictive) bakery, The Golden Croissant. Lucky for us, we get an early look at their numbers to see how they performed after an exciting year—remember, they went public this year! And guess what? The books look pretty sweet.
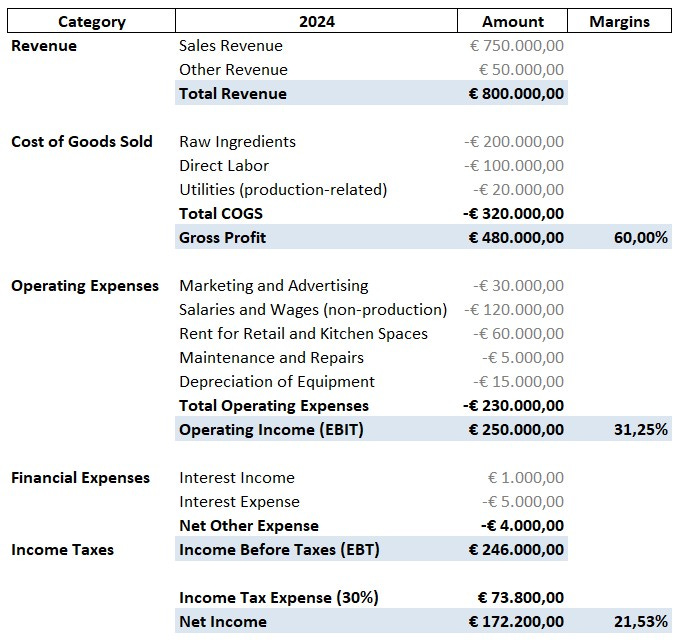
Let’s dive into their income statement. Now, keep in mind, this is a simplified version. Real-world income statements often come with layers of complexity—leases, accruals, intercompany transactions, you name it. But for our purposes, we’ll focus on the big picture: using the income statement to verify the company’s story. If you recall from our previous article, my co-author Milan emphasized the importance of qualitative analysis—things like management and a company’s moat. But here’s the catch—those stories need to be backed up by the numbers. Fancy words don’t mean much if they’re not reflected in reality. And where better to fact-check than in the hard numbers of an income statement? So, let’s start with the numbers and see what story they tell.
“Wait—what’s all this? Just a bunch of numbers?” I hear you thinking. Don’t worry. Let’s tie it back to the story we’ve been following. We identified three key moats for The Golden Croissant:
A strong brand.
A prime location.
Proprietary recipes and baking techniques that wow the competition.
You’ll see these moats reflected in their gross margin. A high gross margin shows the company can sell its products at a premium. Picture this—10 bakeries of the same size in the same area all buy ingredients and hire staff at roughly the same price. Let’s say it costs 90 cents to produce one croissant. Most bakeries, lacking a strong brand or prime location, might sell their croissants for €1, leaving them with a 10% gross margin.
But not The Golden Croissant. Thanks to its reputation, prime location, and secret recipe, it sells croissants for €2.25, giving it a 60% gross margin. That premium pricing power is the moat in action—the ability to sell at a higher price than competitors without losing customers.
Now, let’s talk costs. The Cost of Goods Sold (COGS) is often variable—it increases as production and sales grow. Think of it this way: more croissants sold means more ingredients and labor are needed, so costs rise accordingly. It’s possible that the cost per unit drops due to volume rebates, but this is certainly not always the case.
Then there are fixed costs, which include things like rent and salaries for administrative staff. These tend to stay the same regardless of sales volume, so as production scales up, the cost per unit decreases, boosting profitability. Together, these costs are captured under Selling, General & Administrative Expenses (SG&A).
For example, marketing and advertising costs reflect the investment in building a strong brand—one of the moats. Rent for retail and kitchen spaces ties into their prime location. Salaries and wages for non-production staff keep operations running smoothly.
Depreciation deserves special mention. It’s not an actual cash outflow but an accounting method to allocate the cost of an asset over its useful life. In reality, the bakery pays for equipment upfront, but accounting spreads that cost over several years. That’s why we add back Depreciation (€15,000) to EBIT (€250,000) to calculate EBITDA—a measure often used to gauge cash flow generation.
This is a useful metric for now, but keep in mind it gets trickier with more complex income statements. EBIT (Earnings Before Interest and Taxes) is especially important as it shows how much money the company generates purely from its operations. A higher EBIT is always better, but make sure to compare it with similar businesses in the same industry. For us, it’s safe to say that The Golden Croissant is doing very well operationally, at an EBIT margin of 31,25%.
To summarize the operational goal of any firm: generate more revenue, preferably through premium pricing, while keeping costs as low as possible—without compromising the company’s moats.
Financial expenses and income reflect cash flows unrelated to operations. Think interest paid on loans or dividends earned from investments. Corporate taxes, of course, are payments to keep the government running.
I know—that’s a lot to digest. But this process of connecting the numbers to the story separates great investors from average ones. As the investing legends often say: “Invest in what you know.” Understanding a business model helps you make sense of costs, revenues, and, most importantly, the moats that give a company its edge.
Cash Flow Statement
Let’s move on to the second piece of the financial puzzle—the cash flow statement. Think of it as the company’s bank statement, tracking every euro flowing in and out. It’s often the most revealing document for valuing a business because it shows what’s really happening with the money. The cash flow statement breaks down into three parts: (1) cash flows from operating activities, (2) cash flows from investing activities, and (3) cash flows from financing activities. For now, let’s focus on the first two, since the third one deals more with funding than operations.

I get it—cash flow statements can feel like a brain teaser at first. But stick with me. Let’s take it step-by-step. Since we’re talking cash flows, we need to add back any non-cash expenses to net income. First up—depreciation gets added back. Easy, right? Now, let’s dig a little deeper.
Remember how I mentioned earlier that buying an asset isn’t directly recorded as a cost? Same goes for inventory—it’s technically an asset, not an expense, until those croissants are sold. But the cash to buy that inventory? That’s gone the moment we pay the supplier. So, if The Golden Croissant increased its inventory—from 100 to 200 kilograms of dough, for example—that’s cash tied up and no longer available. If dough costs 10 EUR/kg, this 100 kg increase means 10,000 EUR less cash.
Now let’s talk receivables and payables. Imagine receivables as IOUs from customers—we’re owed money, but it’s not in the bank yet. More receivables? Less cash available. Payables are the opposite—money we owe but haven’t paid yet. More payables? More cash in hand (for now).
Together, these three are part of working capital, which measures a company’s ability to cover short-term bills with short-term assets.
Here’s the key takeaway: An increase in working capital reduces cash, and a decrease in working capital frees up cash. Since The Golden Croissant is growing fast, they’ve increased inventory and receivables while decreasing payables—leading to a total cash decrease of 20,000 EUR. All of this ties into operating cash flow, which is crucial for valuing a company because it shows how much cash is available for reinvestments and financial activities like repaying debt or rewarding investors with dividends.
Now let’s keep things simple and jump to investing activities. This section is about buying and selling assets and investments. For example, The Golden Croissant spent 50,000 EUR on new equipment to support growth. But they also sold some investments, pulling in 10,000 EUR in cash. Investing activities are a big deal because they show how much a company reinvests for future growth. If you’re ever doing a discounted cash flow (DCF) analysis, this reinvestment rate is key to predicting growth potential.
That’s a lot to take in, I know. But understanding cash flow is worth the effort—it’s the ultimate reality check for a company’s financial health.
Final Remarks
Since it’s Christmas, I’ll keep this short so you can get back to celebrating with your loved ones. Before I sign off, I just want to leave you with one final thought. At the end of the day, these are just numbers. What really matters is the story they tell about a company and how that story plays out in the real world—where sales are made, costs are managed, and people drive results. Financial statements aren’t about number-crunching magic; they’re about uncovering the truth behind a business’s journey.
If you’re curious to explore further, I’ve included the Excel file at the end of this article. And don’t worry—there’s more to come! In the next and final part, we’ll dive into financing activities and some advanced concepts. Until then, happy holidays and happy investing!