


Increasing The Odds Of Finding Winning Investments
Stock Screening: A Step-by-Step Process

"We look for a horse with one chance in two of winning and which pays you three to one."
— Charlie Munger
The main goal for any active investor is to consistently “beat the market” by finding stocks that generate better returns than the broader indices. However, this is no easy feat—even professionals, with advanced tools and expertise, often struggle to outperform the market. That’s why any method that improves the odds of finding high-performing stocks is invaluable.
One such tool is stock screening, a simple yet effective way to narrow down the pool of potential investments. It’s important to note that stock screening isn’t about making buy decisions directly; rather, it helps identify a handful of interesting stocks that are worth further investigation. For example, instead of evaluating every company in a large index like the S&P 500, screening allows you to focus on a smaller, more manageable set. This increases efficiency and can also reveal promising stocks you might not have considered otherwise.
Here’s a step-by-step guide to conducting a stock screening, using a financial database (like Refinitiv) and basic calculation software, such as Excel.
Step 1: Choosing Variables
The first step in stock screening is deciding which stocks to analyze and which criteria to use. A good starting point is to choose an index, such as the S&P 500, that includes a sufficient number of stocks—at least 30 or more.
Next, you’ll need to select the variables you want to evaluate. In our previous screenings, we focused on metrics such as earnings consistency, Return on Invested Capital (ROIC), Capital Expenditures, and Free Cash Flow growth. However, the choice of variables depends on your specific investment strategy. You could also consider dividend-related metrics or pricing ratios like Price-to-Earnings (P/E) or Price-to-Book (P/B). We recommend choosing 5 to 8 variables to avoid overwhelming the process, but you can adjust this based on the goals of your screening.
Step 2: Processing the Data
Once the data is imported into your calculation software (in our case, Excel), it’s time to compare the stocks based on the selected variables. It’s crucial to remember that this comparison is relative to the other stocks in the set. If you accidentally select underperforming stocks, even the “best” stock in that group may still be weak compared to the broader market. This is why screening is a tool for narrowing down options, not for making final buy decisions.
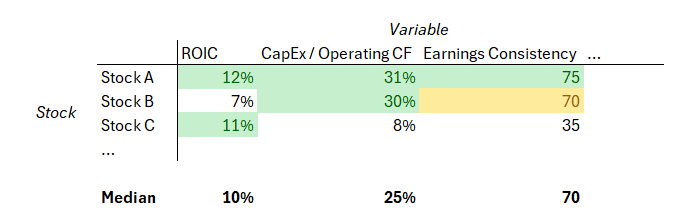
A good way to start is by calculating the median for each variable. We prefer the median over the average because it is less affected by outliers, which can distort results. After calculating the median, you can use Excel’s Conditional Formatting feature to color-code the stocks that perform above the median for each variable. This visual approach makes it easy to spot which stocks are consistently strong across multiple metrics.
As shown in the example below, you can quickly identify the best-performing stocks based on the color-coded results. You can also track how many variables each stock outperforms the median on. Though we won’t dive into specific Excel formulas here, feel free to reach out for help if needed.
The next step is to perform a simple regression analysis. While some may shy away from statistics, regression can be a helpful tool to estimate whether a stock is over- or undervalued. Essentially, regression analysis shows how much each variable contributes to a stock’s price. This allows you to calculate an expected price for the stock based on its performance relative to others. By comparing this expected price to the current market price, you can get a sense of whether the stock might be undervalued or overvalued.
It’s essential to recognize that one of the main weaknesses of this approach lies in the calculations, which rely heavily on the quality of the input data. Additionally, the selected variables provide only a snapshot of a company's performance at a specific moment in time, introducing potential biases. For instance, a well-performing and undervalued company might be excluded due to a one-time event, like a write-off affecting earnings. Other risks stem from statistical issues, such as skewed distributions, which can further distort results.
Step 3: Final Stock Selection
The final step is to create a shortlist of stocks for deeper investigation. A good starting point is to look for stocks that consistently perform above the median across most variables and are also undervalued according to your regression analysis. These are the stocks that are performing well based on your chosen metrics but may not have their full potential reflected in their current price.
After narrowing down the list, it’s time to conduct a brief investigation of each company, reviewing their profiles and key financial metrics. At this point, we recommend focusing on the 3 to 5 stocks that seem most promising for further analysis.
Conclusion
In conclusion, stock screening is a powerful tool for refining a large set of potential investments into a more manageable list of stocks for further review. While it doesn’t make buy decisions for you, it significantly improves the efficiency of stock selection by highlighting key financial metrics that align with your investment strategy. By using methods like median-based comparisons and regression analysis, you can identify undervalued stocks with strong performance indicators, giving you an edge in finding opportunities that may beat the market. Ultimately, stock screening is a practical starting point for conducting more in-depth research and making smarter investment decisions.