

Invert, Always Invert
Reverse DCF 101

“Invert, Always Invert”
- Charlie Munger -
I know what you’re thinking: “Oh great, another so-called ‘investor’ quoting Charlie Munger.” Honestly, that’d probably be my first reaction too. But before you roll your eyes and click away, give me a chance to redeem myself. Today, I want to talk about something refreshingly simple—yet strangely underused by most investors. It’s funny how the simpler an idea is, the harder it becomes for people to believe it actually works. Most investors stick to the classic DCF model—just like they teach you in every Finance class. And don’t get me wrong, I’m not here to bash the DCF. It’s a solid tool. But when you’re dealing with smaller or more unpredictable companies, it can be incredibly hard to apply.
That’s why I want to walk you through the concept of a Reverse DCF (or Inverted DCF, for those still riding the Munger wave).
We’ll kick things off with a small introduction, the pros and cons of using an RDCF. Then I’ll show you how I’ve applied it to one of my own well-performing stocks: Renault. Of course, it’s not all sunshine and rainbows—so I’ll also touch on the challenges and common pitfalls to watch out for.
As always: grab a hot coffee, and let’s dive in!
What is a RDCF?
Before we jump into the reverse gear, let’s first take the classic DCF for a spin. More precisely, the discounted dividend model (aka DDM). It's kind of the vintage sports car of valuation methods—rarely used these days, but a nice ride for teaching the basics.
Here’s the formula for the DDM:

What’s this telling us? Basically, a company’s price (P) is a function of its dividend (D₀), how fast that dividend is growing (g), and how picky we are about returns (r, the discount rate). If the denominator shrinks (r - g), price shoots up. Classic math magic. So if we set the discount rate at 10%, a company growing dividends at 3% has a numerator of 7%. But crank that growth (g) up to 8%, and suddenly you’re dividing by 2%. Boom: the valuation soars.
Now, let’s put on our DCF goggles and morph this into something more modern. Instead of using dividends, we’ll swap in Free Cash Flow to the Firm (FCFF)—the trusty sidekick of enterprise value. But heads up: FCFF is a firm-level cash flow, while price is an equity-level metric. Apples and oranges. So we adjust by moving from Price to Enterprise Value (EV). And since EV = Equity Value + Net Debt, everything stays nice and clean.
Our new formula looks like this:
Sound familiar? It should. This is the same formula you use to calculate the going concern value in a regular DCF—except now, we’re assuming that stable growth kicks in tomorrow, not 10 years from now. No time travel required.
Now for the finance nerd twist (brace yourselves): once you pick a discount rate (say, 10%), this formula only has one mystery variable left: the growth rate, g. That’s right—the rest can be pulled from the company’s latest financials: Market Cap + Net Debt = EV, and FCFF₀ is straight off the statement of cash flows. Rearranging the formula to solve for g gives you this:

(…which you’ll solve numerically in Excel. Solver is your best friend here.)
In a traditional DCF, you guess the growth rate and get a valuation. But here, you start with the market valuation—and work backwards to see what kind of perpetual growth the market is assuming. Which is honestly kind of brilliant. You’re not asking, “What’s it worth?” but rather, “What does the market think it’s worth—and why?”
Okay, now that you understand the basics, let’s look a little deeper under the hood: why does this work and when doesn’t it work?
Pros
So, why should you care about this Reverse DCF wizardry? Well, for starters, it’s wonderfully straightforward. You grab three numbers—market cap, net debt, and FCFF from the latest financials—and you’re off to the races. Plug those into the formula, pick a discount rate, and boom: you’ve revealed what kind of growth the market is already pricing in. Want to get fancy? Tweak the discount rate across a range, and suddenly you’ve got a neat little tool for seeing how expectations shift with investor sentiment. It’s like peeling back the market’s poker face.
Another reason this method shines is flexibility. Yes, the base model assumes perpetual growth starting tomorrow, but you’re not stuck with that. If you’ve got projections or assumptions for the next decade, you can stretch this formula to account for multi-stage growth—kind of like adding chapters to a book before the “forever” ending. It gets a bit mathy, but Excel’s Solver can handle the grunt work for you. And trust me, when you plug in real company data (like Renault’s, which we’ll look at shortly), it becomes clear how powerful this can be.
Maybe the best part? You don’t need to play fortune teller. Forget estimating terminal EBIT margins, capital expenditures in 2033, or how AI will reshape their cost structure. The Reverse DCF lets you work with numbers straight from the latest financials—numbers that actually exist today. That makes it refreshingly easy to compare across companies. You can even build a basic screener in Excel: load up a few stocks, run the formula, and see which ones are priced for perfection and which ones seem a bit more grounded.
Cons
But let’s not get carried away—this model has its cracks too. For one, while it technically avoids assumptions, it doesn’t really let you skip thinking. Suppose the formula tells you the market is pricing in 5% perpetual FCFF growth. Is that reasonable? It depends. Maybe FCFF was low this year due to a one-off capex spree. Or maybe management’s investing aggressively today to drive future returns. So, while the formula doesn't require you to guess growth, interpreting the result forces you to mentally run through a dozen “what ifs” about the company’s strategy and sector dynamics. Assumptions creep back in, whether you like it or not.
Then there’s the issue of the perpetual growth rate itself—it’s kind of a blunt instrument. In the real world, growth isn’t a straight line. Markets cycle, consumer trends shift, costs fluctuate. But the Reverse DCF locks you into a single growth rate—forever. Traditional DCFs let you model a recession, a recovery, a margin expansion. Here, unless you’re expanding the formula into a multi-stage version, you lose that nuance.
This limitation also makes it harder to build multiple scenarios. The only lever you really have is the discount rate, so if you want to test different strategic outcomes or risk levels, your sandbox is kind of small. And finally, there’s the risk of being misled by a funky base year. If FCFF was depressed due to unusually high investment or a temporary headwind, but the market still believes in the business (so EV remains high), the implied growth rate can come out looking crazy high—and paint a distorted picture of the company’s prospects.
So yes, the Reverse DCF is clever, quick, and insightful—but like any good tool, it works best when you know its limits. Use it with care, and it can help you see exactly what kind of future the market’s betting on.
Practical Example: Renault
Alright, time to put theory into practice. Let’s plug in some real numbers for Renault:
Enterprise Value (EV): €62,326.36
FCFF₀: €3,075.34
Required Return (r): anywhere between 5% and 20%
And here’s what we get when we run those numbers through our Reverse DCF model:
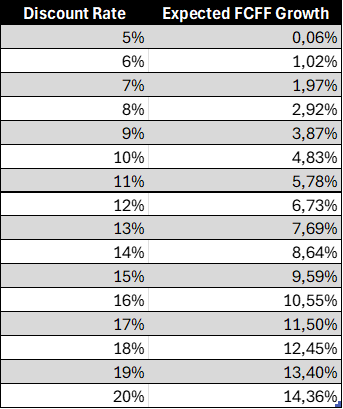
Remember, we’re talking about perpetual growth rates here—steady, unchanging growth from now until forever (or, at least, as far as markets dare to imagine). If you believe a long-term FCFF growth rate of 3–4% is realistic for Renault, the market is implying an annual return in the ballpark of 9–10%. Not too shabby. Feeling extra bullish? Say you think Renault can pull off a 6–7% perpetual growth rate—well, the model suggests you could expect returns around 12–13%. Pretty impressive.
On the flip side, if you’re a bit more cautious and assume long-term growth of just 2–3%, the implied return drops to around 7–8%—right in line with the historical average return of the S&P 500. All in all, this example nicely shows how Reverse DCF helps you peek behind the market curtain and understand what kind of growth is being baked into the price.
Now, let’s take one small step further into slightly nerdier territory.
What if we tweak the formula to estimate not just a single perpetual growth rate, but the average growth over the next ten years before settling into a stable rate? This turns the Reverse DCF into a two-stage model—but don’t worry, we’ll keep it manageable.
Here’s what we’re assuming:
Perpetual Growth Rate (after year 10): 2%
Required Return: 10%
Because this version of the formula involves solving a non-linear equation (don’t worry about the math-y jargon), I’ll keep it simple and only run it for these specific inputs. If you’re feeling ambitious and want to automate the process with Excel Solver or a script, go wild—the sky’s the limit.
Here’s what we get:

According to the model, Renault would need to grow FCFF at roughly 8% per year over the next 10 years, ending up with about €6,630.57 in FCFF in year 10. From that point on, growth levels off to the steady 2% we assumed earlier.
This is getting into more advanced territory, and since it's Wednesday and we’re all just trying to make it to the weekend, I’ll leave the deeper math for another time (or never). But even at a high level, this gives you a good sense of how flexible—and powerful—the Reverse DCF can be when you start layering in more realistic growth assumptions.
Let’s wrap this up with a few final takeaways…
Key Takeaways
In the end, the Reverse DCF is a clever and surprisingly accessible tool for cutting through the noise and understanding what the market really expects from a company. Instead of forecasting future cash flows yourself, you start with the market valuation and work backwards to uncover the implied growth assumptions. It’s simple to set up, uses only a handful of inputs, and doesn’t rely on vague long-term projections. Whether you're a cautious investor or a growth optimist, the Reverse DCF helps frame valuation in a new, market-driven light. Just remember—it’s only as good as the numbers you feed it, and while it avoids explicit assumptions, interpreting the results still requires thoughtful judgment. Use it as a conversation starter with the market, not the final word.
💬 What do you think about using Reverse DCF this way? Drop your thoughts below—I’d love to hear your take!
🔔 Like this kind of breakdown? Make sure to subscribe so you don’t miss out on future deep-dives into valuation, market psychology, and all the fun stuff in between!


