


Buckle up, because today we’re diving into a topic that’s been hiding in plain sight—multiples! Over the course of 42 articles (yes, 42—time really flies, doesn’t it?), we’ve explored everything from REITs to top-down analysis. But somehow, multiples always managed to dodge the spotlight. Not anymore. Today, we’re putting them front and center.
Multiples were my first taste of investing. I still remember it like it was yesterday: someone exclaimed, “Apple is trading at 15x P/E—it’s never been this cheap!” And there I was, thinking, “Wow, investing is a breeze. Just learn the lingo, toss around some ratios, buy a few stocks, and voilà—rich!” Spoiler alert: it’s not that simple.
Multiples are everywhere. Yet, they’re often misunderstood or oversimplified. So, let’s fix that. In this article, we’ll start with the basics: what multiples actually represent and when they’re useful (or not). Then, we’ll demystify those magical numbers: is 55x P/E a bargain or daylight robbery? Is 2x P/S a steal or a trap? I’ll help you develop a sense of what’s “cheap” and “expensive” in the world of multiples.
Finally, we’ll connect the dots between these ratios and the fundamental drivers of stock value. Master this, and you’ll be well-equipped to navigate the jungle of investing metrics like a pro. So, grab your favorite beverage, find a comfy spot, and prepare to ascend to the lofty heights of Master of Multiples. Let’s get started!
The Basics
Let’s talk about one of the most iconic players in the multiples world: the P/E ratio. Yes, that’s Price-to-Earnings for those keeping track. As the name suggests, it’s all about how a company’s price stacks up against its earnings. Imagine this: if a company has a P/E of 15, it means the market values the company at 15 times its earnings from last year. Or, put simply, investors are willing to pay $15 for every $1 of the company’s profits. Easy math, right?
Now, if that company kept churning out the same profits year after year (no growth, no decline), you’d theoretically recoup your investment in 15 years. But here’s the catch: this assumes no growth at all—no booming sales, no cost-cutting wizardry. It’s a static measure, like hitting “pause” on a company’s financial movie. So why even bother? Well, the beauty of the P/E ratio is its simplicity. It’s quick to calculate and lets you compare stocks faster than you can say “Excel spreadsheet.”
Speaking of spreadsheets, once you have reliable data—maybe we could use DeepSeek for that—P/E ratios are super handy for screening lots of stocks, like the 500 companies in the S&P 500. You can instantly see which ones look cheap and which ones are pricing in a yacht full of optimism. Fun fact: we even built a stock screener back in one of our first articles! Swap in your favorite multiples, and voilà—a customized tool to sift through the market.
But remember, a multiple is just a snapshot of a company’s story, not the whole book. A high P/E might signal an overpriced stock—or it might just mean the company had a rough year with unusually low earnings (hello, big investments or one-off costs). To avoid missing hidden gems, I always recommend using multiple multiples. Each sheds light on a different angle of the business, like flipping a diamond to see every facet.
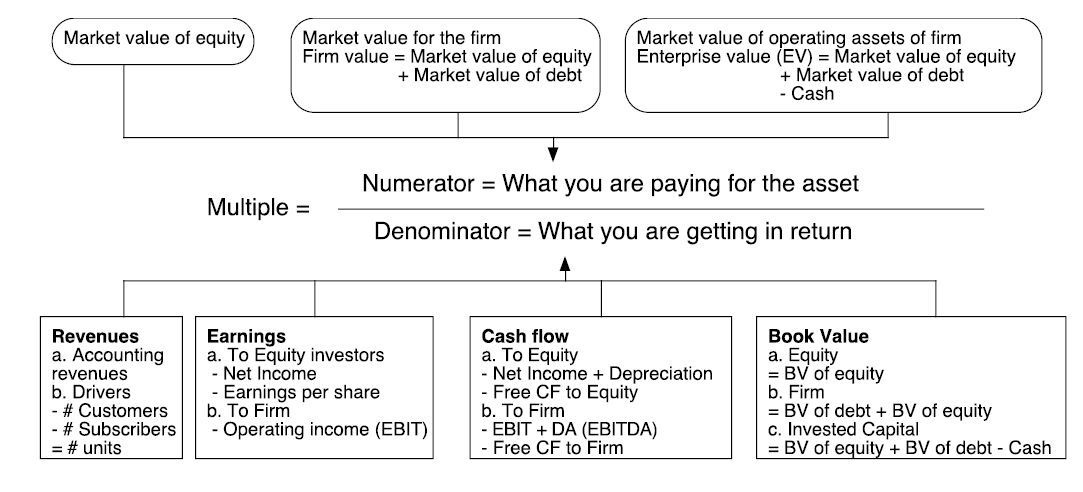
Now, let’s spice things up with types of multiples. There are two dimensions to consider: what the multiple measures and how it measures it. First up, the what. Some multiples focus on a company’s operations (e.g., EV/EBITDA). This one uses Enterprise Value (EV)—which is like a company’s full price tag—and compares it to earnings before interest, taxes, depreciation, and amortization. Translation: it looks at the company’s core business, ignoring the noise from debt, taxes, or accounting quirks.
On the flip side, equity-focused multiples (like our old friend P/E) measure performance from the shareholder’s perspective. The key rule? Don’t mix these two worlds. Pair operational metrics (like EV) with other operational data, and equity metrics with other equity-related figures. An EV-to-earnings ratio, for example, is about as useful as a screen door on a submarine—it doesn’t tell you much.
Next, let’s move to the how of multiples. There are two ways to approach this. First, you can compare a company to its peers. But here’s the golden rule: comparable means comparable. Think same sector, similar size, similar capital structure, or even similar dividend policies. The more aligned the companies are, the better your comparison. Second, there’s the transaction angle. When companies get acquired, the transaction price reflects how much buyers are willing to pay, and these deal multiples can provide a ballpark for valuing similar firms. Just keep in mind that M&A pricing is influenced by things like market sentiment and negotiation power, so take it with a grain of salt.
Finally, here’s a pearl of wisdom: “Beauty is in the eye of the beholder.” Comparing multiples is what we call pricing, not valuation. Pricing is like comparing your house to the one down the street based on features like the number of rooms or the size of the garden. Valuation, on the other hand, is about projecting the cash flows your house might generate (say, rental income) and discounting them to today’s value. Both methods have their strengths, so use them wisely—and ideally together.
Finally, I’ve put together a visual representation of the basics of multiples. It highlights various metrics and whether they fall under an equity-related approach (a) or an EV-related approach (b). There’s also a third option worth mentioning: the Firm Value approach, which combines Market Capitalization and Market Value of Debt. However, since it’s less commonly used in practice, we’ve left it out of the scope of this article:
“Normal” Multiples
Alright, now you’ve got the basics of multiples down. But let’s be real—what are some practical, realistic multiples you can actually use? Well, as with most things, it depends. Think of companies like houses: a sprawling mansion with a gorgeous garden will always fetch a higher price, just like a stellar company. Similarly, neighborhoods matter too—industries that are “hot” and full of potential often command higher multiples. The point is, the “average” for multiples isn’t one-size-fits-all—it’s heavily influenced by the sector. And more importantly, some multiples work like magic in one industry and fall flat in another. Let’s break it down with a few examples.
Take the biotech industry, for instance. Biotech firms are usually all about potential—no revenue, massive R&D budgets, and huge losses, but with the promise of a billion-dollar blockbuster drug someday. If you tried using a P/E ratio here, you’d be yelling at a wall—it’s useless with negative earnings. Instead, something like the Price-to-Book (P/B) ratio makes more sense. Biotech companies tend to have tons of valuable intellectual property, like patents, sitting on their balance sheets. The P/B ratio helps reflect that hidden value.
Now, let’s move to the tech sector—the land of sky-high growth and ambitious dreams. For these companies, growth is the name of the game. That’s why the PEG ratio (Price-to-Earnings-to-Growth) is so handy. It’s like a P/E ratio, but smarter—it factors in the company’s expected earnings growth (PEG = P/E ÷ Expected Growth). Since growth is where a lot of a tech company’s value lies, this is a much more useful metric for comparison.
Finally, let’s talk cyclical industries, like automotive or steel. These sectors are at the mercy of economic cycles—booming in good times and struggling in downturns. Here, a plain old P/E ratio can be misleading because it swings wildly with the cycles. A relative P/E ratio works better. This compares the current P/E to historical benchmarks. For example, if the current P/E is 10, and over the last 10 years the range was 5 to 20, the relative P/E would be 50% of its 10-year high and double its 10-year low. Pretty handy, right? Another option is to use normalized earnings, which smooth out any unusual gains or losses over a longer time frame.
Now, check out the graphs below:

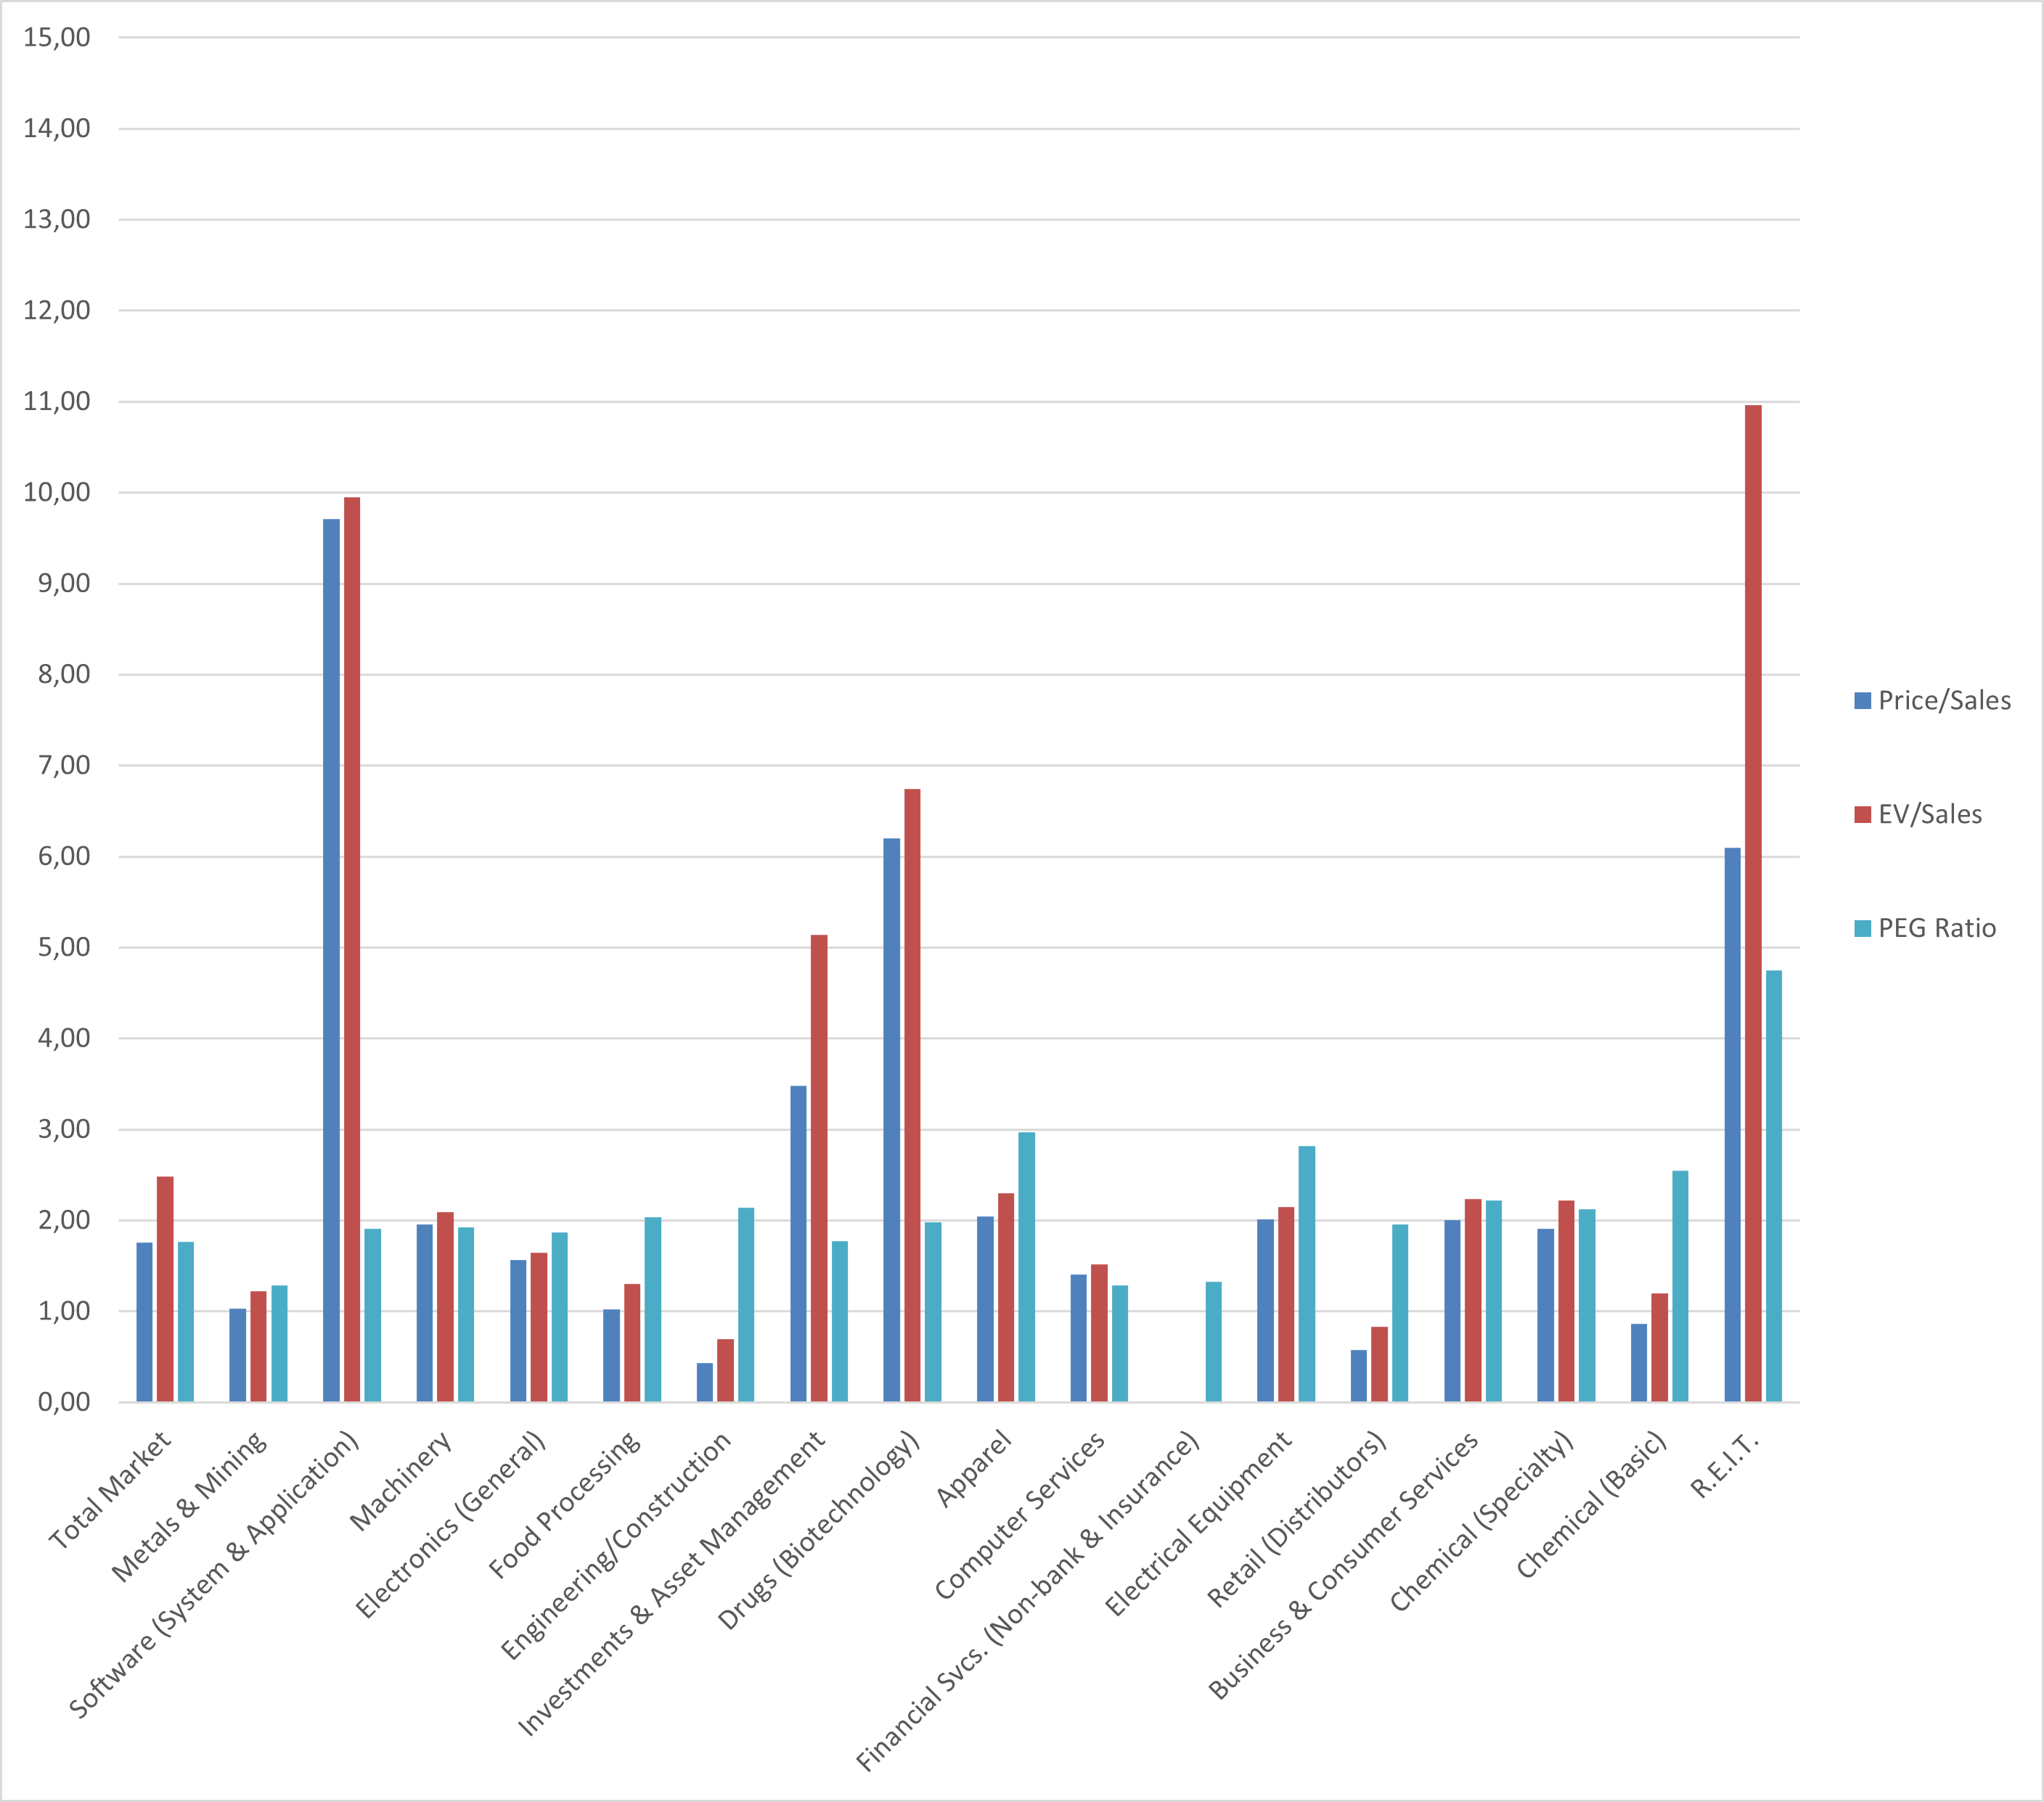
It shows the latest average multiples across industries as of January 2025. Take a close look—it’s a stark reminder of how much multiples can vary by sector. For instance, the light-blue bars (P/E ratios) go through the roof, with some exceeding 100 (or even 437!). Meanwhile, dark-blue bars (EV/EBITDA) hover above 100 for certain industries. By contrast, P/S, EV/S, and PEG ratios tend to be smaller and far less volatile.
I hope this gives you a better sense of what’s “normal” for different industries. As always, I’ve linked the data source below for your own research. To wrap things up, I’ll talk about how these ratios connect to the fundamental value drivers of a business.
Fundamental Drivers
Let’s take a moment to connect the dots between fundamental drivers and multiples—it’s like uncovering the secret recipe for valuation. I’ll walk you through it with an equity multiple first, then show you how it works for an EV-based multiple. Spoiler: once you nail this process, you’re well on your way to becoming a bona fide Master of Multiples. Ready? Let’s dive in.
First, a quick refresher on the key ingredients: cash flows and growth (g) boost intrinsic value, while risk (r) drags it down. Got it? Good. Now, let’s start simple with the equity side of things. If you’re using the Dividend Discount Model (DDM), the price of a stock can be calculated as:
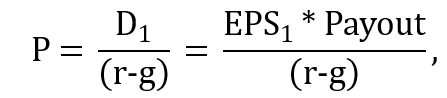
In plain English, that’s just another way of saying: dividends come from earnings, and the payout ratio tells us how much of those earnings get passed to investors. So, if EPS (earnings per share) in year 1 is €10 and the payout ratio is 50%, the dividend is €5. Simple, right? Now, let’s jazz it up a bit. To get to the P/B (Price-to-Book) ratio, we divide everything by the book value per share (B). Dust off those high school math skills and voila:
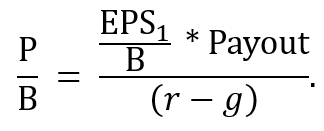
You’re probably sighing, thinking, “Okay, but what does that mean?” Well, let me make it crystal clear: EPS/B happens to be the Return on Equity (ROE). So now we’ve got:
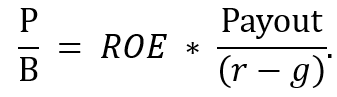
And just like that, the P/B ratio is driven by ROE, the payout ratio, risk, and growth. Pretty neat how it all ties together, right? It’s like the 42 articles we’ve written so far are converging into one beautiful formula.
Now let’s look at the trusty P/E ratio:
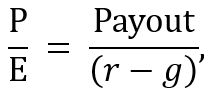
Here, EPS cancels itself out, leaving us with something elegant: P/E is all about the payout ratio, risk, and growth.
But wait, there’s more! Moving to the world of EV-based multiples, things get a tad more complex. Starting with intrinsic value for enterprise value, we have:

Where:
FCFF is free cash flow to the firm.
NOPLAT is after-tax operational profit.
RIR is the reinvestment rate.
t is taxes.
Now, let’s take the EV/S (Enterprise Value to Sales) ratio as an example. Divide both sides by sales, and you get:
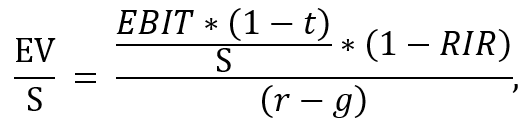
Here, EBIT/S is your EBIT margin, adjusted for taxes. This tells us the EV/S multiple is influenced by the after-tax operational margin, the reinvestment rate, risk, and growth.
I know, it might feel like we just waded through a swamp of equations, but once you understand how intrinsic value links to multiples, you’ve unlocked a whole new level of investing mastery. And let’s be honest—these days, plenty of tools can help make the math a breeze.
Now, before we wrap up, let’s pull everything together with some quick takeaways and a few final remarks to leave you inspired and ready to conquer multiples!
Final Remarks
Let’s wrap this up with a few key takeaways to leave you feeling confident about multiples. First off, don’t let the formulas freak you out. Unfortunately, math is unavoidable in finance, but the good news is that the core concepts are always the same. Once you’re familiar with the handful of value drivers, it’s like building with LEGO—you can mix and match them to create a meaningful story. It’s definitely not rocket science, just a framework to help make sense of the numbers.
Next, dive into some real-world examples. Take a look at the multiples of your favorite, most outrageous companies—yes, even those meme stocks—and compare them to their industry averages. Getting a feel for what’s “normal” (or not) can be a huge asset. Spotting whether a company seems cheap or wildly overpriced just by glancing at a few multiples? That’s the kind of investing superpower you’ll want in your toolkit.
Finally, let’s talk about the golden rules of multiples. First, remember you’re pricing companies relative to each other, not valuing them based on their actual cash flows. Pricing is about context, not absolutes. Second, whatever you do, DON’T mix enterprise-related metrics with equity-related ones—it’s like trying to bake a cake with the wrong recipe. Those mismatched multiples may look like they mean something, but trust me, they’re not telling you much. And always double-check your assumptions: Are you factoring in growth? Is this multiple even relevant to this industry? The more thoughtful you are, the better.
So, let this all sink in, take a breather, and enjoy the rest of your week. And don’t forget—on Friday, Milan will be back with what looks like an awesome follow-up on Top-Down Analysis. Be sure to subscribe, and I’ll see you back here soon!
References
Data for Multiples: https://pages.stern.nyu.edu/~adamodar/