


The Secret to Predicting Recessions?
Exploring The Yield Curve

Imagine having the ability to foresee economic shifts—the power to know when markets are set to soar or sink. Sounds like a superpower, doesn’t it? Well, there’s a tool out there that brings you one step closer to that kind of insight. It’s called the “Yield Curve,” and if you’re in the finance world, chances are you’ve already heard its name whispered with a touch of reverence. But what exactly is this mysterious curve, and how did it earn a reputation for predicting recessions?
A few years ago, I found myself asking these very questions. Driven by curiosity (and, yes, fueled by countless cups of coffee), I dove into everything I could find about this economic crystal ball. Today, I’m excited to share what I’ve uncovered about the Yield Curve—and why it’s considered such a powerful indicator.
As writers just starting out, we’re always eager to hear what resonates with readers. So if you have thoughts, feedback, or ideas on topics you’d like us to explore, don’t hesitate to leave a comment or message us directly. Let’s dive in!
NORMAL YIELD CURVE
Creating the Yield Curve is actually pretty simple. Imagine you take a series of bonds with the same issuer, like U.S. Treasury bonds, but with different maturities—say 2 months, 3 months, 1 year, 5 years, and so on—and plot them against their respective yields. That line you get? That’s the Yield Curve. In essence, the Yield Curve tells us what return, or "yield," we can expect for a bond depending on how long we’re willing to invest. In a stable economy, this curve slopes upward—steeper at the start, then leveling off as maturities get longer.

Why does it look like this? In short, longer-term investments tend to have higher yields. But why? Let’s consider a familiar scenario to illustrate some of the reasons.
Say your friend Bob wants to borrow €10,000 for an exciting new venture. He gives you two options: a one-year loan with 2% interest or a 10-year loan with a rate still up for negotiation. Naturally, you'd want a bit of time to think about the right rate for the 10-year loan. Here's what might cross your mind:
"I know Bob’s finances are solid for the next year, but what about 10 years from now?"
This is called credit risk—the uncertainty around whether a borrower will still be in good financial shape years down the line. Longer-term loans carry more of this risk because it’s harder to predict the future, so lenders demand a higher yield to offset it."Inflation seems manageable right now, but what if it spikes over the next decade?"
This concern is known as inflation risk. If inflation rises, the purchasing power of the return on your loan could decrease. Investors expect compensation for taking on this risk, which contributes to higher yields on long-term bonds."Interest rates are at 4.75% now, but what if they climb even higher?"
This is interest rate risk. If interest rates go up, the value of existing bonds goes down because new bonds offer better rates. Investors need a higher yield to balance this risk, especially on long-term investments where the potential for rate changes is greater."I could put this €10,000 in the stock market and potentially earn more, even if it’s riskier. Should I lend it to Bob instead?"
This is about opportunity cost. By lending to Bob, you miss out on other investments that could offer higher returns, so you might want a premium to make it worthwhile. Investors are always balancing risk with reward, seeking the best return for a given level of risk.
Other risks also play a role. For example, liquidity risk—the possibility that you might need to sell the bond early at a lower value than you paid for it—and political or regulatory risk, where policy changes might affect the bond’s value. Each of these risks adds to the yield required for long-term bonds.
So, these factors explain the typical upward slope of a normal Yield Curve: the longer you’re tied up in an investment, the higher the risks, and the greater the return investors expect as compensation. This all makes sense in a stable economy. But what happens if this logic doesn’t hold, and the Yield Curve turns upside down? That’s when we get into the realm of the "Inverted Yield Curve," and its implications—something we’ll dive into next.
INVERTED YIELD CURVE
Let’s dive into the Inverted Yield Curve. The name isn’t misleading—it truly does look like the flipped version of a "normal" yield curve. By now, you’ve likely realized that this means the long-term yield drops below the short-term yield. Does this turn our earlier explanation of the yield curve on its head? Well… no. What it actually means is that the economy—and by extension, most investors—are putting their focus on the near future, reshaping their priorities to protect against looming uncertainty.
Visually, the inverted yield curve looks like this:

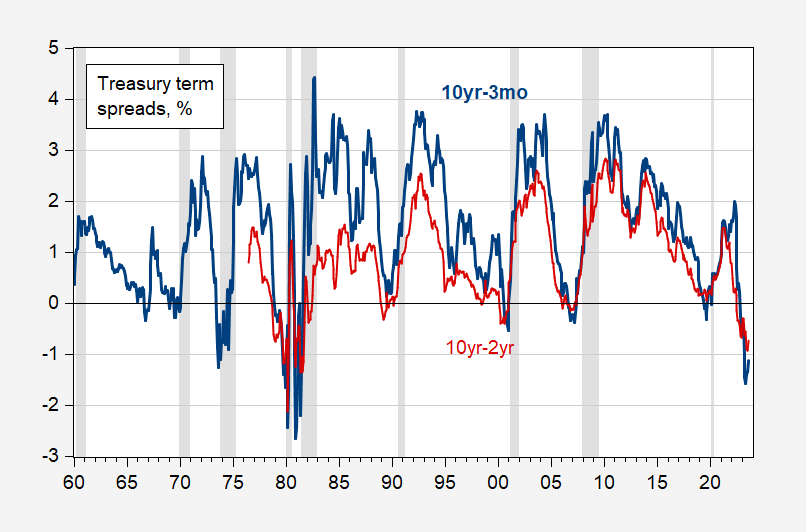
Now, let’s introduce a new concept: the “Term Spread.” Simply put, the Term Spread calculates the difference between a short- and a long-term yield, typically the 10-year (long-term) yield minus the 3-month (short-term) yield. In a normal yield curve, the Term Spread is positive because long-term yields are higher than short-term ones. But in an Inverted Yield Curve, as you might expect, the Term Spread is negative. This inverted Term Spread has historically been a warning sign of recessions. Here’s a chart illustrating this relationship over time: the blue line represents the Term Spread, and the shaded gray areas show recessions. Notice how, over the past 50+ years, each time the Term Spread dips below zero, a recession soon follows.
In 2006, economist J. Wright identified two main reasons that could lead to an Inverted Yield Curve and, potentially, a recession: (1) a tightening policy (usually by central banks raising short-term interest rates) and (2) increased demand for long-term bonds. Here’s how each scenario plays out:
Tightening Policy: In this case, rising short-term rates push the short end of the yield curve up first. Over time, long-term yields also start to rise, and eventually, the yield curve returns to a normal shape. During this period, investors might shift their money into short-term bonds due to the higher yields, pushing up prices and causing short-term yields to fall again. Meanwhile, less demand for long-term bonds lowers their prices, and long-term yields rise. Gradually, the yield curve finds its way back to normal.
Increased Demand for Long-Term Bonds: This reflects a lack of confidence in the short-term economy. When investors flock to long-term bonds, their prices go up, and yields fall, making long-term yields lower than short-term ones and inverting the yield curve. This scenario often signals real economic fear and may precede a recession.
Only the second scenario truly reflects recession concerns. To improve predictions, Wright developed a model that combines the Term Spread, Term Premium, and Federal Funds Rate. This more comprehensive approach helps investors better anticipate recessions. However, remember that even though an inverted yield curve has often preceded recessions, the timing of these downturns is unpredictable. Plus, it’s often only clear that we’re in a recession in hindsight, which brings in something called hindsight bias—when we believe we "knew it all along."
FINAL REMARKS
To wrap things up, the yield curve is indeed a powerful indicator for gauging economic trends—but it’s just one part of a much larger picture. Relying solely on it, or acting too quickly on its signals, can lead to risky investment choices. The aim of this article isn’t to inspire you to design complex models with countless factors to forecast every economic blip in every market, trying to time every possible downturn. Instead, it’s here to introduce you to one of finance’s essential tools. Personally, I don’t lean on it too heavily, as I focus more on long-term outlooks, while recessions tend to be relatively short-term events. Still, as someone who loves finance, I find the yield curve fascinating. It elegantly connects bond yields, prices, and investor risk perception for specific timeframes, making it a brilliant concept in finance.
I hope this article taught you something new! Feel free to share your feedback, and I look forward to seeing you next time!
Other articles you might like:
References
Cochrane, J. H., & Piazzesi, M. (2008). Decomposing the yield curve. Graduate School of Business, University of Chicago and NBER. Retrieved from https://papers.ssrn.com/sol3/papers.cfm?abstract_id=1333274
https://econbrowser.com/archives/2023/09/term-spread-watch
Hayes, A. (2023, September 27). Yield curve: What it is and how to use it. Investopedia. https://investopedia.com/terms/y/yieldcurve.asp
Wright, J. H. (2006). The yield curve and predicting recessions. Finance and Economics Discussion Series, Divisions of Research & Statistics and Monetary Affairs, Federal Reserve Board, Washington, D.C. Retrieved from https://papers.ssrn.com/sol3/papers.cfm?abstract_id=899538
Please note: This article includes a disclaimer regarding investment advice.