


Decoding Financial Statements II
A Financial Point Of View

Happy New Year, everyone! 🎉 From both of us at DualEdge Invest, we’re sending you our warmest wishes for a fantastic 2025—may it be a year full of growth, success, and new opportunities!
To kick off 2025 strongly, we’re picking up right where we left off: financial statements. In last week’s article, we tackled them from an operational angle, diving into the income statement and most of the cash flows. But as many of you know, financial statements come as a trio.
So, to wrap up this topic and sharpen those financial skills right away, we’ll finish exploring the cash flow statement and then dive into the balance sheet. Since these sections focus more on how a company is financed rather than how it earns, we’ll approach it from a financial perspective.
Grab a coffee—or maybe some water and aspirin if you’re still shaking off the New Year’s celebrations—and let’s dive in!
Financing Cash Flow
Alright, we’ve covered most of the cash flow details, but there’s one last piece of the puzzle—cash flow from financing activities. Let’s take another look at the cash flow statement to break this down step-by-step:

Now, public companies typically rely on two main ways to raise funds: debt—think loans or bonds—and equity, owned by shareholders. But, as we all know, money doesn’t come for free. Banks expect loan repayments (plus interest), and investors want their slice of the pie too, usually through dividends or share buybacks.
For our purposes, how the financing happens isn’t as important as when those payments are made. So let’s talk timing.
After taking care of all operational expenses and reinvestments, The Golden Croissant still has €127.2K in cash—€167.2K from operations minus €40K reinvested back into the business. Now, the big question is—what do they do with it?
First things first, they settle up with the bank. They owe €20K on an existing loan. Done. Next, they decide to increase leverage slightly by taking out a smaller loan of €50K—that’s the Loan Proceeds entry in their cash flow statement.
And since they’re still sitting on a decent pile of cash, they decide to thank their investors with dividends. With 10K shares outstanding, they pay €3 per share, totaling €30K in dividends.
Interestingly, the net financing cash flow balances out at zero—they paid out €50K but brought in €50K from the new loan.
But here’s the twist—The Golden Croissant has big plans for next year. Rumor has it, they’re eyeing a takeover of their arch-rival, Sweet Eclairs (don’t tell them!). So, instead of spending every last euro, they decide to park the remaining cash on the balance sheet—just in case.
Of course, stacking up too much cash can be risky too. It’s great to have a cushion, but at some point, idle cash stops working for you—it becomes what’s often called “dead cash.” That’s why good management teams (like the one at The Golden Croissant) are always balancing three priorities—building reserves, reinvesting in growth, and rewarding investors.
And with that, we’re ready to dive into the final statement—the balance sheet—where we’ll see how all these decisions tie together. Let’s keep going!
Balance Sheet
Now that we’ve explored cash flow and financing, it’s time to dive into the balance sheet—the financial snapshot that shows what a company owns (assets) and what it owes (liabilities). Think of it as the company’s blueprint, revealing how its resources are funded, whether through debt or equity. And, as the name suggests, it always has to balance—because every asset needs a source of funding.
One key feature of the balance sheet is how it separates short-term (less than a year) and long-term (more than a year) assets and liabilities. This gives us a clearer picture of what the company owns and owes, not just now, but also in the future.
Here’s something important to keep in mind—unlike the income statement and cash flow statement, which capture the flow of money over time, the balance sheet is a snapshot of the company’s financial position at a specific moment. Think of it like a photo album that shows growth year over year, while the income and cash flow statements act more like time-lapse videos that reset each year.
Now let’s take a closer look at The Golden Croissant’s balance sheet:
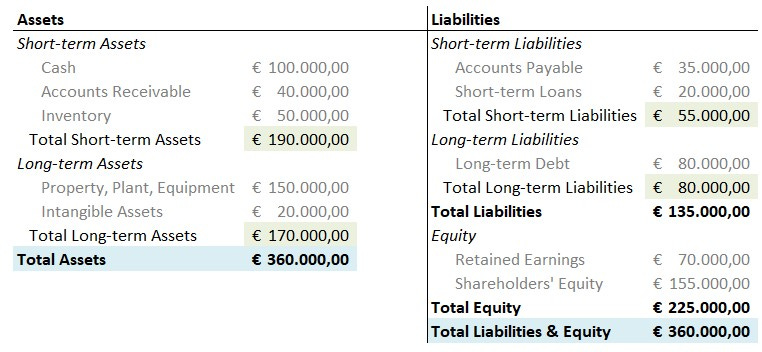
On the asset side, we have short-term items like cash, accounts receivable, and inventory, alongside long-term items such as Property, Plant & Equipment (PPE) and Intangible Assets (patents, for example). These resources are the engine that powers cash generation. The more efficiently a company can generate cash from its assets, the better.
Let’s compare: The Golden Croissant generates €100K EBIT with €360K in assets, while its rival, Sweet Eclairs, needs €500K in assets to produce the same EBIT. That’s a Return on Assets (ROA) of 27% for The Golden Croissant versus just 20% for Sweet Eclairs—proof that our favorite bakery is running a tighter, more efficient operation.
Flipping to the liabilities and equity side, there’s an important distinction. Equity is like permanent capital—it sticks around as the business grows—while debt eventually needs to be repaid. Equity also shares in profits, so when the business thrives, shareholders reap the rewards. Lenders, on the other hand, settle for fixed repayments.
In terms of debt, The Golden Croissant has €20K in short-term obligations and €80K in long-term debt, for a total of €100K. That means €20K is due next year. Equity, meanwhile, is made up of Retained Earnings—profits the company has made—and Shareholders’ Equity, the original investment from owners.
This setup also gives us insights into leverage—how much of the company’s growth is powered by borrowed money. Think of it like buying a house. If you put down €50K in equity and borrow €250K, your leverage ratio is 5x (five euros of debt for every euro of equity).
For The Golden Croissant, the debt-to-equity ratio is 0.6, and the debt-to-asset ratio is 37.5%—healthy levels that show the company isn’t overly reliant on debt. Of course, there’s no magic number for leverage; what’s “good” depends on the industry, interest rates, and cash flow stability.
Beyond leverage, there are other tools to assess financial health, like the Current Ratio (short-term assets vs. short-term liabilities) and the Interest Coverage Ratio (ICR), which measures how easily a company can cover interest payments with its earnings.
The goal here wasn’t to overwhelm you with formulas but to give you a feel for how balance sheets can highlight solvency, leverage, and efficiency. While this example keeps things simple, real-world balance sheets—especially for public companies—often include advanced elements like goodwill, lease contracts, and unearned revenue.
We’ll save those for another day. For now, let’s wrap things up with a quick recap of what we’ve covered and key takeaways to keep in mind.
Final Remarks
To wrap things up, there are two key ideas I hope you’ll take away from this.
First, a company’s financials can—and should—be analyzed from two distinct perspectives: (1) its operations—how it generates cash—and (2) its financing—how it funds its resources. That’s exactly why I divided these articles into two parts. Both perspectives are equally important, and separating them helps uncover insights that might otherwise go unnoticed. For example, two companies could generate cash in identical ways but be valued very differently based on their financing strategies—or vice versa. So, keep this division in mind when reviewing financial statements. Operations are mostly reflected in the income statement and part I of the cash flow statement (see Part I of this series), while capital structure and financing decisions show up in part II of the cash flow statement and the balance sheet (discussed in this article).
Second, this article focused on the balance sheet—the foundation that outlines a company’s resources (assets) and how those resources are funded (liabilities and equity). We also looked at the cash flow statement to see the impact of these financing decisions—tracking the inflows and outflows of cash tied to debt and equity. Broadly speaking, funding comes from either external sources (debt) or internal funds (equity), and the mix of the two forms the capital structure. While there’s no one-size-fits-all “optimal” structure—it depends on factors like cash flow, industry, and company size—this is exactly where strong management and strategic decision-making make all the difference.
If you keep these points in mind as you analyze companies, you’ll already be ahead of the curve. That’s it for now—I hope you found this article helpful and insightful. Thanks for reading, and once again, Happy New Year!
P.S. I’ve included the Excel file with the (fictive) financial statements—sorry for leaving it out last time!
Please note: This article includes a disclaimer regarding investment advice.