


[FREE] A Guide On Key Financial Metrics
Warren Buffett once said that he — and Charlie Munger — never needed a computer or calculator to analyze an investment. “Too complex,” he quipped, waving off anything that couldn't be understood with simple arithmetic and sound reasoning.
Just for today, I’m taking a page from that book. Kind of.
See, in finance, complexity often disguises itself in layers of jargon and models. But at its core? The best insights tend to rest on simple fundamentals. Strip things down far enough, and you’re left with a handful of basic truths that force you to ask the most important question of all: not just what you're analyzing — but why.
That’s where the real magic happens.
So, in this article, I’m heading back to basics. At the heart of every valuable company lie two missions:
Sell more.
Do it as efficiently as possible.
The first one’s easy to spot — just look at revenue growth. If sales are climbing, the company is moving product.
It’s the second one — efficiency — that tends to hide in the numbers. That’s where things get interesting.
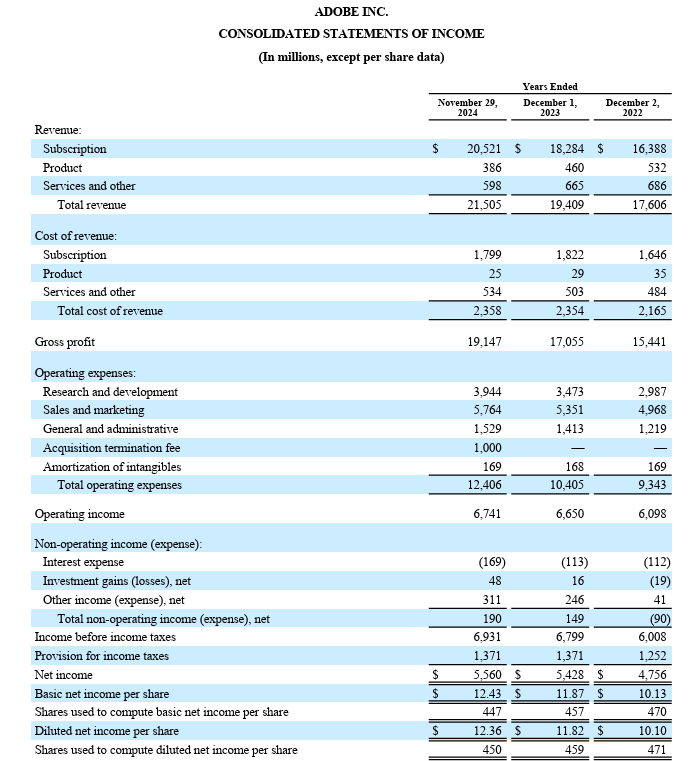
I’ll walk you through how I think about operational efficiency, using a simple framework we often use at DualEdge Invest. To keep things practical, we’ll break it down using Adobe — a company most investors are familiar with, and one that offers a great case study in both growth and execution. For your reference, I’ve included screenshots of the financial statements used and the annual report at the back of this article.
And while I may end up reaching for a calculator (sorry, Mr. Buffett), it’ll only be for a few quick divisions.
So grab a coffee, settle in, and let’s break down what really makes a company hum...
1) Return on Assets (ROA)
WHY
Return on Assets (ROA) tells you how efficiently a company is converting everything it owns — buildings, intellectual property, equipment, you name it — into profit. It’s a great gut check on operational efficiency: are they doing more with less?
Let’s say Company A and Company B each earn $10,000 in operating profit. But A has only $50,000 in assets, while B has $100,000. Their ROAs are 20% and 10%, respectively. That means A is making double the return on every dollar of assets — more bang for the same buck.
Here’s the key: ROA includes all assets, no matter how they’re funded. That means both equity (what the company owns outright) and liabilities (what it borrows). So this metric captures how well the business manages all of its resources, not just the ones it paid for itself.
Key Takeaway
ROA measures how efficiently a company turns total resources — both owned and borrowed — into operating profit.
HOW
There are different ways to calculate ROA, depending on which type of profit you use. Some investors prefer net profit, but I like to go with operating profit (EBIT) — it reflects the core performance of the business, and let’s be honest, it keeps the math simpler. Efficient, not lazy.
Here’s Adobe’s ROA, using EBIT:
ROA = Operating Profit / Total Assets
ROA = $6,741 / $30,230 = 22%
Not too shabby.
2) Return on Equity (ROE)
WHY
If ROA asks how well a company uses everything it controls, Return on Equity (ROE) zooms in on just one thing: how effectively the company uses shareholder money.
That’s the core of ROE — it tells you what return the business is generating on the funds you, the investor, would be putting in.
Now here’s where things get interesting: companies can boost their ROE through leverage. Borrowing more lets them use other people’s money to drive growth. Done wisely, this can supercharge returns. But too much debt, and that high ROE starts to look a bit... artificial.
For this reason, ROE is often higher than ROA — unless the company has zero liabilities, in which case the two are equal.
Key Takeaway
ROE measures how efficiently a company uses its own capital — but be mindful, because leverage can make things look rosier than they really are.
HOW
ROE is usually calculated using net profit instead of operating profit, since it represents the actual return to shareholders after all expenses.
For Adobe:
ROE = Net Profit / Shareholder’s Equity
ROE = $5,644 / $14,105 = 40%
To see how leverage plays into this, we can break it down:
ROE = (Net Profit / Total Assets) × (Total Assets / Equity)
ROE = ROA × Leverage Ratio
ROE = (5,644 / 30,230) × (30,230 / 14,105) = 18.7% × 2.14 = 40%
There you have it — math meets meaning.
3) Liquidity Coefficient
WHY
Now let’s shift gears and talk balance sheet — cue the fireworks.
While income metrics like ROA and ROE tell us about performance, the Liquidity Coefficient offers a snapshot of short-term financial health. It’s grounded in working capital — the difference between a company’s current assets (cash, receivables, inventory) and its short-term liabilities (bills due soon).
In plain terms: it tells you whether a company can pay its short-term debts without breaking a sweat. Positive working capital is a good sign — it means the company has some breathing room. Negative? That’s when you start eyeing the exits.
Key Takeaway
Liquidity Coefficient measures the safety cushion: how easily a company can meet short-term obligations using short-term assets.
HOW
Instead of subtracting liabilities from assets, the Liquidity Coefficient expresses them as a ratio:
Liquidity Coefficient = Current Assets / Short-Term Liabilities
Anything over 100% means the company could, in theory, sell its current assets and pay off what it owes in the near term — and still have something left over.
Let’s take Adobe. Excluding deferred revenue (not a true liability), here’s what the math says:
Liquidity Coefficient = $11,232 / ($10,521 - $6,131) = $11,232 / $4,390 = 256%
That’s a 156% margin of safety. Rock solid.
Now, sometimes you’ll want to get more conservative and exclude inventory, especially for companies selling physical goods. Not all inventory turns into cash quickly. A helpful companion metric here is the Inventory Turnover Ratio:
Inventory Turnover = Cost of Goods Sold / Average Inventory
The higher the number, the faster the company is moving product — and the more liquid that inventory really is.
But with Adobe? They don’t sell physical products, so inventory isn’t part of the picture. In this case, strict or standard, the liquidity story stays the same.
Closing Remarks
By now, you’ve seen how a few basic ratios — ROA, ROE, and the Liquidity Coefficient — can peel back the layers of a company and show you what’s really going on under the hood. These aren’t exotic metrics. No Wall Street wizardry required. Just some thoughtful division, a critical eye, and maybe — just maybe — a calculator.
But here’s the catch: numbers alone aren’t the story. Context is everything.
A 22% ROA might look stellar — until you realize that the company’s closest competitors are clocking in at 30%. A 40% ROE sounds impressive, unless it’s being juiced by excessive leverage that could turn around and bite the business in tougher times. And a healthy liquidity ratio? Great — as long as it's not hiding poor inventory management or sluggish receivables.
That’s why comparing these ratios across peers (same industry, similar size, comparable growth profiles) is key. You’re not trying to find “good” numbers in a vacuum — you’re trying to understand whether this company is winning in its arena. Same goes for looking within the same company over time: Is the trend heading in the right direction? Are they becoming more efficient, more resilient, and better capital allocators year after year?
Ratios are like reading a pulse. Useful — but only if you know what a healthy heartbeat looks like.
Which brings us full circle, back to the beginning. Warren Buffett didn’t need a calculator — but he also didn’t need noise. He relied on a few clean numbers, looked at them in the right context, and asked the simplest, most powerful question of all:
“Does this make sense?”
So yes, we’ve reached for a calculator today. But only as a means to an end. Because when you use it with intention — and not as a crutch — the calculator stops being a symbol of complexity and becomes what it should be:
A tool for clarity.
Thanks for reading.
📢 What’s your go-to ratio when sizing up a company? Drop it in the comments!
🔔 Subscribe now to catch Sunday’s Amazon breakdown — where efficiency meets empire…
Please note: This article includes a disclaimer regarding investment advice.
Financial Statements Used


Full Annual Report:
Our Recent Posts
The Market Punished Aris. Was It Right?

Normally, today would have been the grand finale of our Amazon deep dive series — the piece we’ve been itching to deliver because, frankly, it’s a juicy one. To everyone eagerly waiting — sorry, you’ll have to hang tight until next Sunday.
Oh, Deere — Are Investors Facing a Bumpy Ride?

Welcome back to — yes, already — Part III of our Deere & Co deep-dive.
The Way Forward For Amazon

Today, we’ve arrived at the final part of our Qualitative research on Amazon. Normally, this is the point where I’d dig back into the numbers—running a fresh check on the balance sheet and income statement before moving forward.
This was an excellent back-to-basics breakdown. Loved how you balanced simplicity with depth—especially the reminder that ratios are only as good as the context around them. The Adobe example made things super tangible. And that closing line? “A tool for clarity.” Nailed it. Subscribed!