


How to Value REIT's
Dont ask your real estate agent. Do it yourself!


If you’re reading this, chances are you’ve already dipped your toes into the fascinating world of Real Estate Investment Trusts (REIT’s). (If not, check out our first article explaining how REIT’s work—it’s worth your time.) Today, we’re tackling a big follow-up question: how do you actually value a REIT?
When we set out to value a company, our go-to approach is almost always building an FCFF model. We’re firm believers in the importance of Free Cash Flow (FCF), so naturally, a model centered around it seems like the obvious choice. But when we looked into our first REIT valuation two years ago, we quickly realized something was off. The FCFF model didn’t quite capture the true value of the company.
That realization kicked off a journey to uncover better valuation methods, and fortunately, it paid off. Today, we’re sharing the lessons we learned about valuing REITs. Equally important, we’ll dive into why a Free Cash Flow to Firm (FCFF) model doesn’t work in this context. Spoiler alert: REITs are a whole different beast.
Why FCFF Falls Short for REIT’s
Here’s the thing: FCFF is like that fancy Swiss Army knife you bring camping—it’s versatile, but not every tool is practical for every situation. For REITs, FCFF just doesn’t cut it, and here’s why:
Dividend Distribution Requirements: REIT’s are legally required to dish out at least 90% of their taxable income as dividends. This leaves little room for reinvestment, meaning cash flows aren’t exactly free—they’re spoken for.
Capital Structure Dependency: REIT’s thrive on external funding—think debt or equity issuances. This makes it tricky to predict cash flows purely from operations. Because REITs are required to distribute such a large portion of their profits to shareholders, external funding becomes the only viable way to drive growth. In other words, the cash flows for reinvestment in a REIT come from financing activities, not from operations. And that’s a key distinction that sets REITs apart from your typical company.
In short, FCFF doesn’t tell the whole story. So, what does?
If you’ve spent any time in the financial world, you know they love coming up with new ways to measure performance. The FCFF issue with REITs led to two alternative metrics that fit much better. Enter Funds from Operations (FFO). FFO takes net income and adjusts it by removing certain items that don’t truly reflect the operational performance of a REIT. Here’s the formula:
FFO = Net Income + Depreciation and Amortization − Gains on Sale of Real Estate
FFO offers a clearer picture of a REIT’s operational profitability because it strips away accounting items that aren’t directly tied to core business activities. It’s like focusing on the engine of the car rather than the paint job—it tells you how well the machine is running.
Then there’s AFFO, or Adjusted Funds from Operations, which takes things a step further. AFFO refines FFO by accounting for expenses that do impact a REIT’s cash flow, such as maintenance costs or recurring capital expenditures. Think of AFFO as a more precise measure of the free cash flow available for distributions, offering investors a sharper lens to evaluate performance.
AFFO = FFO − Maintenance CapEx − Straight-Lining of Rent (+ Other Adjustments)
Maintenance CapEx refers to the investments required to keep properties in good shape. Think of it as the cost of keeping the REIT’s portfolio attractive and functional—regular upkeep, repairs, and renovations of existing buildings.
Straight lining of rent is an accounting concept that spreads rental income evenly over the duration of a lease agreement, regardless of the actual timing of payments. Essentially, it means the total rent from a lease is allocated uniformly across its term, smoothing out any irregularities in cash flow.
For example, imagine a tenant signs a 5-year lease with rent payments of $1,000 per month in year one, increasing to $1,200 per month in year two, and so on. Straight-lining would take the total rent over the 5 years, say $72,000, and allocate it evenly as $1,200 per month, even if the actual cash received fluctuates.
With these two metrics, investors gain a clearer view of operational efficiency. However, we can’t simply drop these into an FCFF model as replacements. Instead, let’s explore valuation methods that actually get the job done. Here are two approaches that work.
Relevant Valuation Techniques for REITs
1. Net Asset Value (NAV): The Backbone of REIT Valuation
Let’s take a step back and think about valuation differently. Instead of chasing cash flows, we zoom in on the heart of a REIT—its real estate portfolio. This is where the Net Asset Value (NAV) comes into play. Think of NAV as the REIT’s "real" balance sheet. It’s the value of everything it owns (properties) minus what it owes (liabilities). Simple, right? Here’s how you do it:
Figure out the market value of the REIT’s properties.
Subtract all liabilities.
Divide the result by the number of shares outstanding.
Compare NAV per share to the market price. If the market price is below NAV, it might just be a bargain—or not, if there’s a good reason for the discount.
It’s not unusual for the market price to deviate from NAV. Let’s unpack some of the reasons behind these premiums and discounts:
Company-Specific Factors:
Management Quality: A well-regarded management team can inspire investor confidence, leading to a premium. Conversely, poor management or a track record of underperformance might warrant a discount.
Capital Structure: REITs with conservative leverage ratios (less debt) often trade at a premium due to their perceived stability, while heavily leveraged REITs might face discounts because of higher financial risks.
Portfolio Composition: A REIT with high-quality or strategically located properties may trade at a premium, whereas one with lower-quality assets or less desirable locations may face a discount.
Sector-Specific Factors:
Type of Real Estate: The sector in which the REIT operates matters. For instance, logistics and data center REITs have recently enjoyed premiums due to booming demand, while retail or office REITs might trade at discounts because of structural challenges in their industries.
Sector Outlook: A positive outlook for the specific type of real estate can push prices above NAV, while pessimism or uncertainty can lead to discounts
Macroeconomic Factors:
Interest Rates: REITs are sensitive to interest rate movements. Rising rates can push market prices below NAV as higher borrowing costs squeeze profitability, while falling rates often result in premiums due to cheaper financing and higher property valuations.
Economic Growth: A strong economy can bolster demand for commercial and residential spaces, supporting premiums. Conversely, in recessions, REITs may trade at discounts due to weak demand and rising vacancies.
Inflation Expectations: REITs are sometimes seen as inflation hedges, particularly those with inflation-linked leases. If inflation expectations rise, certain REITs might trade at a premium.
2. Dividend Discount Model (DDM)
REITs are dividend machines, so the DDM is tailor-made for them. It values a REIT based on the present value of its future dividends. Key inputs:
Projected Dividends: What kind of payout can investors expect?
Discount Rate: How much risk are you willing to take for those dividends?
Growth Rate: Will dividends grow? Stay flat? Shrink?
This method resonates with income-focused investors who are in it for the yield. In this model, it’s also crucial to incorporate FFO and AFFO metrics. AFFO is often viewed as a proxy for the free cash flows available for dividend payouts. By comparing AFFO with the planned dividend, you can assess how sustainable a REIT’s dividend policy is and whether there’s a risk of cuts in the future. To project growth, you can examine the historical growth in FFO and AFFO over the past 5 to 10 years, as these are the foundation of profitability. Let’s break it down with an example:
Imagine Sunrise Properties REIT. Over the last five years, this REIT has shown impressive growth, with an average annual increase of 7.21% in Funds From Operations (FFO) and 8.12% in Adjusted Funds From Operations (AFFO). In 2024, the AFFO per share was $3.00, while the dividend per share stood at $2.40. This results in a healthy payout ratio of 80%, indicating that Sunrise Properties can sustainably fund its dividends while still having room for maintenance and growth.
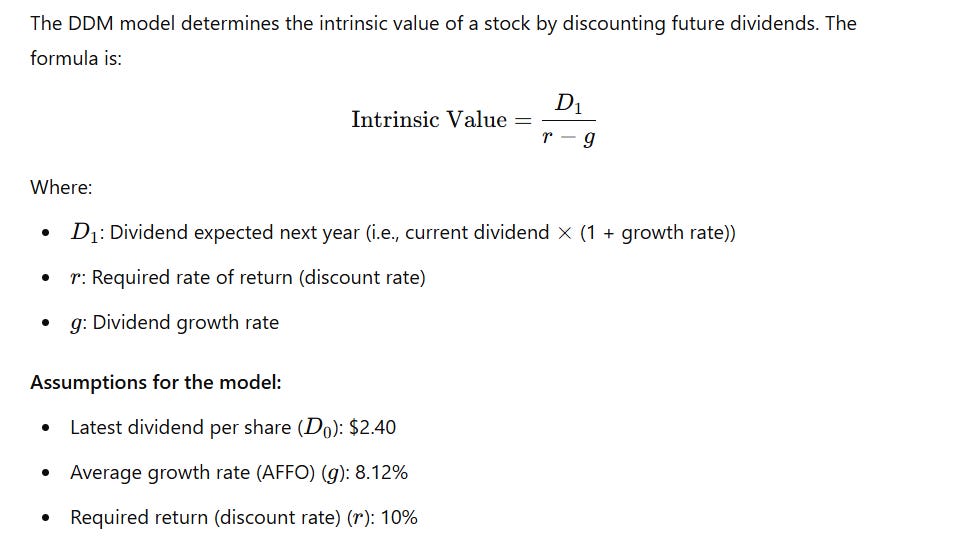
Using the Dividend Discount Model (DDM), we calculated the intrinsic value of the stock by assuming an 8.12% dividend growth rate (in this case, I even took the AFFO growth rate to be extra conservative) and a 10% required return. This gave us a valuation of $138.0. per share. Now, here’s where it gets interesting—if the current market price of Sunrise Properties is below that $138.03 mark, it might just be a golden opportunity for investors.
This example highlights why tracking AFFO growth and dividend sustainability is so crucial when valuing REITs. By focusing on these metrics, investors can make smarter, more informed decisions about where to put their money. So, when analyzing a REIT, ask yourself: is the dividend growth realistic, and can the REIT sustain its payouts over the long haul? Those answers can make all the difference.
Closing remarks
To truly grasp a REIT’s value, methods such as Net Asset Value (NAV) and the Dividend Discount Model (DDM) shine. NAV anchors investors to the intrinsic worth of a REIT’s property portfolio, while the DDM speaks directly to the income-driven nature of these investments. By understanding the factors driving premiums and discounts—be it management quality, sector-specific dynamics, or macroeconomic conditions like interest rates and inflation—investors can better navigate the complexities of REIT valuation.
Ultimately, REIT valuation isn’t about rigid formulas; it’s about context. Whether you’re evaluating dividend sustainability or comparing market prices to intrinsic value, the key is to blend the numbers with a nuanced understanding of what makes a REIT tick. Armed with these insights, you’re not just valuing a REIT—you’re positioning yourself to make informed, confident investment decisions in a sector that continues to shape the future of real estate.


