


Market Structures & Their Impact On Economic Moats
Part I

Imagine strolling through a bustling outdoor market. Vendors are calling out their best deals, colorful fruit is piled high on wooden carts, and the air is filled with the smell of fresh bread and roasted coffee. As you weave through the crowd, something catches your attention - two different stalls selling the exact same apples, but at different prices. A few steps away, a vendor selling handmade jewelry seems to have complete freedom in naming her price, while another stand offers baked goods at a fixed price written on a chalkboard.
How did these prices come to be? Why does one seller adjust their prices freely while another follows a predictable pattern? And why do some markets seem fiercely competitive, while others are controlled by only a handful of firms? These questions aren’t just interesting from a theoretical standpoint - they hold real value for investors trying to understand the forces shaping industries and businesses.
At its core, understanding market structures is about understanding the rules of the game. The way firms compete, the level of control they have over pricing, and the barriers keeping new players out all influence how businesses operate and, ultimately, how much profit they can make. The more competition a company faces, the harder it is to sustain a strong position. On the other hand, firms operating in markets with fewer competitors - or those that have carved out a unique advantage - can maintain pricing power and fend off threats for much longer. This is where economic moats come into play. Recognizing these moats and the businesses that successfully build them is a crucial skill for value investors. And as we’ll see, market structures provide a framework for spotting them.
This will be Part I of a two-part mini-series on the different types of market structures and how they shape competition. But before we get ahead of ourselves, we need to lay the groundwork. Grab a coffee, settle in, and let’s start with the fundamentals.
The Basics
Setting the Stage: Markets, Prices, and a Slice of Pizza
Before we jump into the first two market structures, let’s take a moment to ask: What even is a market structure? Actually, scratch that - let’s zoom out even further. What is a market in the first place?
Economists define a market as a group of buyers and sellers who are aware of each other and can agree on a price while exchanging goods and services. Sounds simple, right? Now, when this magical group of people settles on a price that satisfies both sides, we call it equilibrium - the economic version of a perfect handshake.
Imagine an auction where the same item is sold multiple times. The first sale happens when the buyer willing to pay the most secures the item - let’s say for $100. The next highest bidder gets their shot, but at $90, and so on. Eventually, sellers won’t be willing to go any lower - maybe $40 is their absolute minimum. Even if there are still potential buyers out there willing to pay $30, too bad - the seller calls it quits at $40, and the market reaches equilibrium.
Cracking the Code of Profit Maximization (No Math, I Promise!)
Before we move on to market structures, we need to talk about one last thing - profit maximization. Relax, no formulas involved (cue collective sigh of relief). But to understand how firms behave in different market structures, we need to break down how businesses make their money and why some end up rolling in profits while others barely scrape by.
At their core, firms are profit-seeking machines. Their mission? Sell as much as possible at a high price while keeping costs low - a tough balancing act. To make sense of how they do this, we need to look at two critical revenue concepts:
Marginal Revenue (MR) – This tells us how much extra revenue the firm makes by selling one additional unit. It’s closely linked to the demand curve, and here’s the catch: MR is usually never increasing. Why? Because firms generally have to lower prices (or at least not raise them) to sell more.
Think about when you’re starving and grab a pizza. That first slice? Pure bliss. The fourth slice? Still great, but not as magical. By the eighth slice, you're questioning your life choices. That extra slice adds less to your happiness each time - a perfect analogy for MR.
Average Revenue (AR) – This is total revenue divided by the number of units sold. Since MR tends to drop, AR follows along, but not as drastically. Fun fact: AR will always be at least as high as MR. Capito? Good.
Now, let’s flip the script and talk costs - because businesses aren’t just printing money (well, unless you’re the central bank). Again, we’ve got two key ideas:
Marginal Cost (MC) – This is the cost of producing one additional unit. At first, it goes down because of economies of scale (fixed costs spread over more units). But at some point, reality kicks in - machines get overworked, overtime kicks in, and resources become scarce. Boom - MC starts rising.
Average Cost (AC) – Just like AR, AC follows MC but reacts more slowly. The golden rule? MC will always start increasing before AC does. Why? Because AC only rises once each additional unit starts costing more - so it lags behind MC.
If this still feels a bit abstract, don’t worry - the graphs coming up (Graph II & III) will visually make it all click better than my pizza metaphor.
The Five Forces That Shape Markets
Alright, we’ve almost set the stage for our deep dive into market structures. But before we (finally) dive in, let’s quickly go over the forces that shape how markets function. There are five major forces at play:
The number and size of suppliers
How much products differ from one another (product differentiation)
How much pricing power sellers have
Barriers to entry (how hard it is for new competitors to join the market)
Non-price competition (ways firms compete without changing the price, like branding, ads, and quality improvements)
See the pattern? It all boils down to who sells what, at what price, and how many players are in the game.
If you’ve ever taken an economics class, these forces might ring a bell - they’re basically Porter’s Five Forces, which you’ll see in Image 1 below:

Now, here’s where it gets really interesting - especially if you’re an investor. These five forces directly tie into the concept of economic moats (a.k.a. a firm’s competitive advantage). If a company controls one of these five forces, it builds a strong moat, shielding itself from competition. On the flip side, if a company has a strong moat, it likely has an edge in one of these five areas.
Understanding market structures from this perspective isn’t just useful for economists - it can actually help identify how sustainable a company’s competitive advantage is.
And with that, we’re ready to dive in!
Perfect Competition
Alright, before we dive headfirst into market structures, let me hit you with some visual shock therapy. I’m throwing the graphs at you first - yes, I know they might look overwhelming at first glance, but that’s exactly the point. I want that moment of panic.
But don’t worry - I’ll break them down piece by piece until they make so much sense that you could confidently explain to your five-year-old brother why his lemonade stand isn’t raking in millions. Once we’ve conquered the graphs, we’ll go over the key characteristics of each market structure - things like how many suppliers there are, what the products look like, and what kind of cutthroat business tactics are at play.
First up: Perfect Competition. Buckle up.
The graphs look like this:

Welcome to Economic Utopia (A.K.A. Perfect Competition)
The first graph? That’s your classic Supply and Demand showdown. In an ideal economic world, every market would neatly settle at a perfect equilibrium, where supply meets demand at just the right price and quantity. If nothing shakes things up (no disasters, no sudden avocado shortages, no viral TikTok trends making a random product go wild), the market stays locked in this beautiful balance forever.
But now, let’s zoom in on the firms operating inside this market.
In perfect competition, firms are what we call price takers - which means they have absolutely zero control over the price. Why? Because there’s no product differentiation at all (for the fancy folks, we call this “homogeneous products”). This means the only possible way to compete is price - but that’s a terrible strategy.
Think about it:
If a firm raises its price, buyers will just go somewhere else (why pay more for the exact same thing?).
If a firm lowers its price, it might get the entire market’s demand - but competitors will immediately follow suit and lower their prices too.
This price-cutting game goes on until firms are making just enough to cover their costs, which means their economic profit is exactly zero.
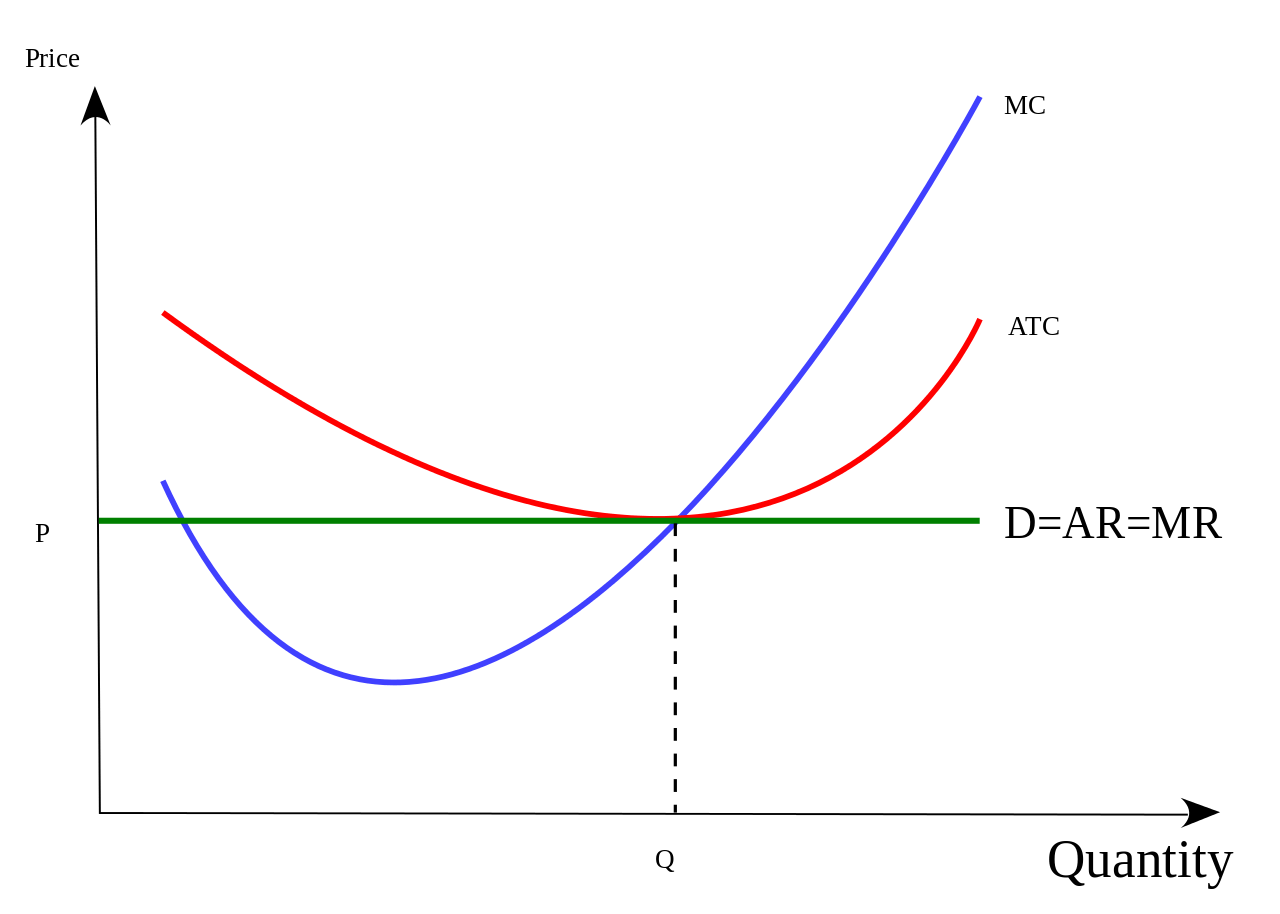
And guess what? That’s exactly what the graph shows.
Firms will keep selling right up to the point where economic profit disappears. At this magical point, MC (Marginal Cost) = MR (Marginal Revenue) - which in perfect competition is just the market price. This means that the cost of making one more unit is exactly equal to the revenue from selling it. So, firms stop producing more units at this point.
Now, let’s get even nerdier for a second. In this market structure:
Average Cost (ATC) = Average Revenue (AR) at equilibrium.
Total cost = Q×ATC, and total revenue = Q×AR.
If ATC = AR, then total cost = total revenue, meaning… drum roll… zero economic profit.
Boom. The math checks out.
By now, you probably get the idea, but let’s lock it in with a quick recap:
Tons of suppliers – no single player can dominate.
Zero pricing power – firms are stuck with the market price.
No product differentiation – everything is identical.
Low barriers to entry – new firms can join in easily, keeping competition fierce.
No non-price competition – no ads, no branding, no fancy packaging - just pure price-driven selling.
Is there a real-life example? Well… not really. In the real world, firms are obsessed with differentiation - whether it’s branding, customer service, or adding tiny unique features to make their product seem better. A near-perfect example might be wheat farmers, who sell their crops at a fixed market price. Sure, there are some barriers to entry (like land access and farming costs), but they don’t exactly get to set their own prices - supply and demand determine everything.
Now that we’ve got perfect competition locked in, let’s move to something a little more interesting - a market that’s part monopoly, part perfect competition: monopolistic competition.
Monopolistic Competition
Alright, things are about to get a little more interesting. The graph for monopolistic competition may look a bit busier than before, but don’t panic - it’s actually pretty intuitive. This market structure feels way more natural than perfect competition. It looks something like this:
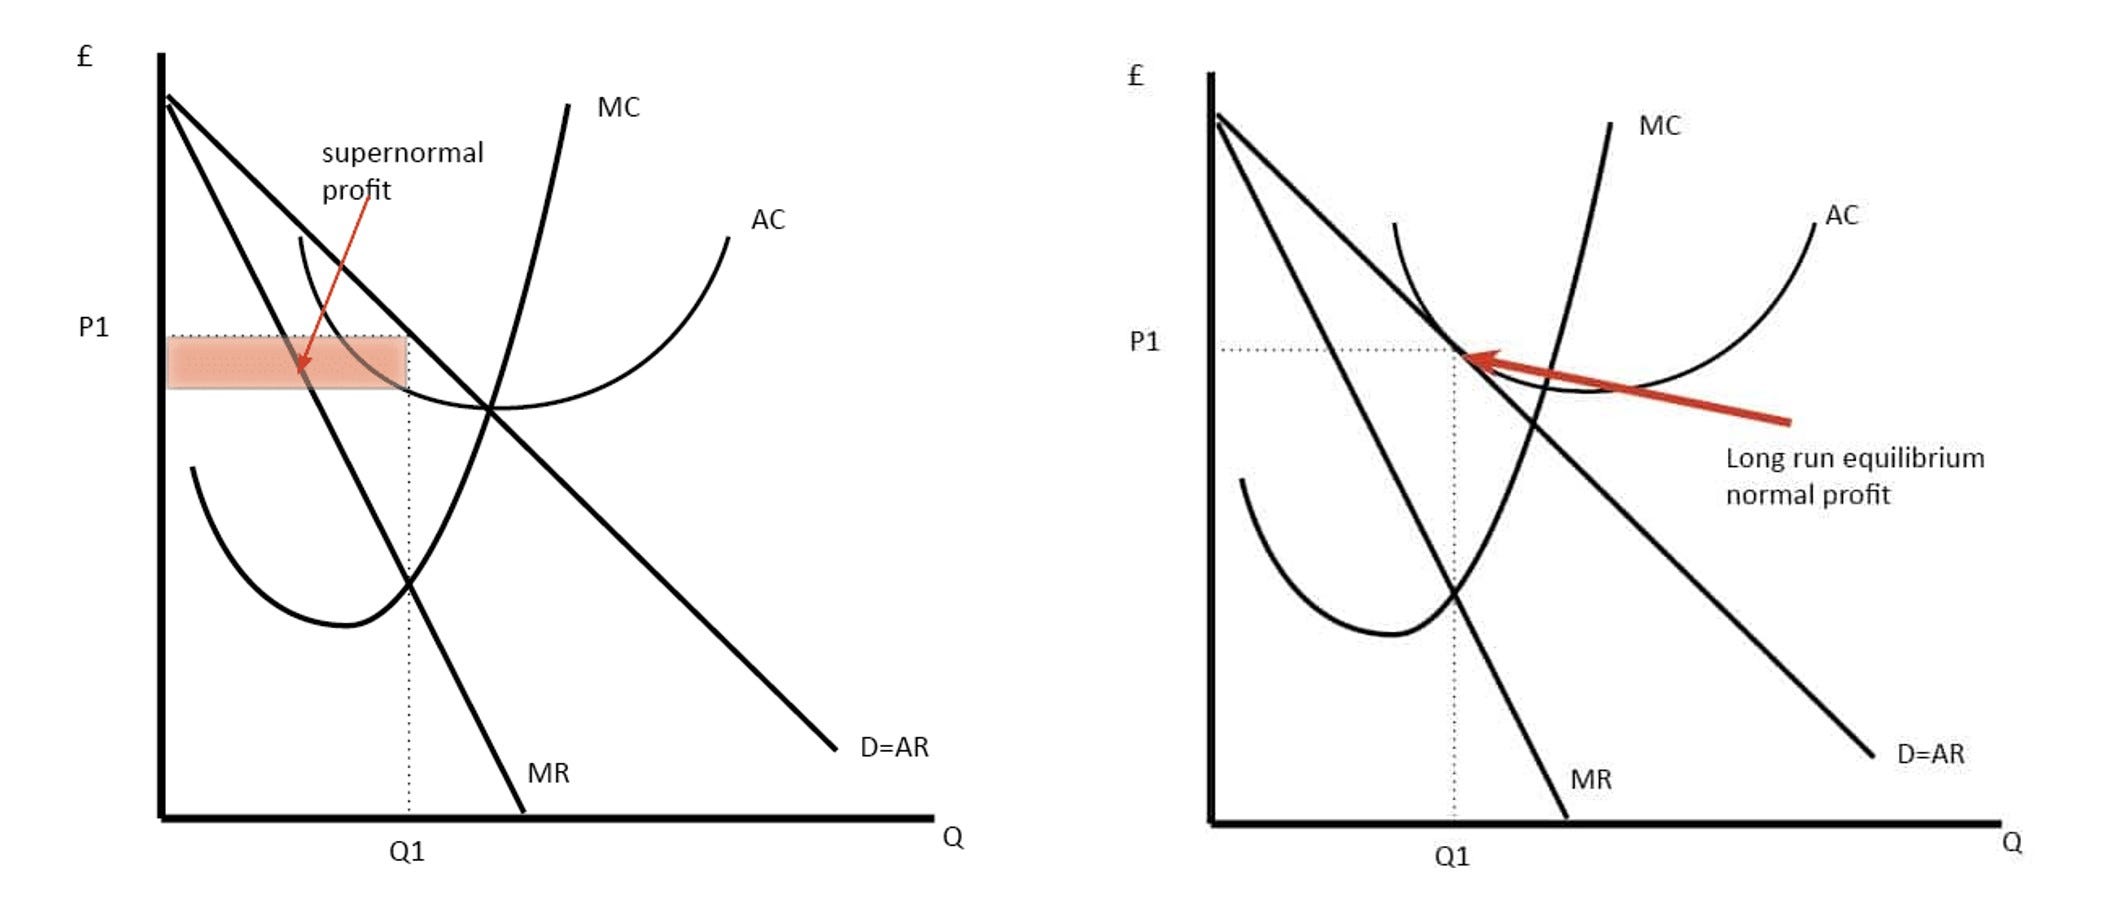
What you see in Graph III are two stories happening side by side - on the left, the short-run, and on the right, the long-run. Let’s start with the short-run tale.
Short-Run: The Profit Party Begins
In monopolistic competition, we still have a lot of suppliers, but this time, there’s a twist: product differentiation. This means firms are no longer just price takers - they actually have some control over their pricing!
Since products aren’t identical (think branded clothing, coffee shops, or cosmetics), firms can charge a bit more for their version of the product. However, this also means that as more units are sold, demand for each additional unit falls - so the average revenue (AR) curve is downward sloping (same as the demand curve, D = AR).
Now, onto how firms decide how much to produce. Just like before, they keep producing until the cost of making one more unit (MC) equals the revenue gained from selling it (MR). At this point, we get Q₁, the short-run equilibrium quantity.
And here’s the fun part: in the short run, firms can make economic profit. Why? Because the average cost (AC) at Q₁ is lower than the average revenue (AR). The red rectangle in the graph highlights this:
The upper band shows how much revenue they make per unit (AR).
The lower band shows their cost per unit (AC).
The gap between the two? That’s economic profit - also known as “supernormal profit” or, if we’re feeling dramatic, economic rent.
Essentially, firms are pocketing extra value because of a slight market inefficiency. Buyers are paying above the cost of production, and that extra value flows straight into the supplier’s pockets. Sounds great for the firms, right?
Well… not so fast.
Long-Run: Competition Crashes the Party
If there’s one thing we know about markets, it’s that profits don’t go unnoticed. Other firms see these juicy economic rents and think, “Hey, I’d like a slice of that pie.”
What happens next? New firms enter the market, intensifying competition. This causes each individual firm’s demand to shrink - customers now have more choices, which means they won’t all flock to the same supplier anymore.
On the graph, this downward shift in demand drags both the AR and MR curves lower. Firms keep producing until MC = MR, but this time, something has changed - AR (price) now equals AC.
The result? Zero economic profit.
At this point, firms cover their costs but don’t make extra profit - they break even. They won’t lower prices further because that would mean selling at a loss. They won’t raise prices either, because customers would just go to competitors. The market has found its balance.
This market structure sits between perfect competition and monopoly. To lock it in, here’s a quick recap of its characteristics:
Lots of suppliers – but not as extreme as perfect competition.
Some pricing power – firms can charge a bit more thanks to differentiation.
Product differentiation – branding, quality, style, or features set firms apart.
Low barriers to entry – new firms can still join in easily, keeping competition alive.
Some degree of non-price competition – marketing, branding, and advertising play a huge role.
Unlike perfect competition, monopolistic competition is actually pretty common. Think about:
Fashion brands – Tons of designers and stores, but each one builds its own image (Gucci vs. Zara vs. H&M). Hoping I don’t get hate mail for grouping Gucci with fast fashion, but hey… it’s all clothes, right?
Cosmetics brands – Same product category, different branding strategies.
Coca-Cola vs. Pepsi – Sure, they both sell cola, but branding makes all the difference.
In these markets, branding is king, and differentiation keeps firms afloat.
Closing Remarks
If you’ve made it this far, first of all - congratulations! I hope the math didn’t scare anyone off, but if you’re still reading, I’d say you handled it just fine.
One thing to keep in mind is that market structures aren’t set in stone. Over time, the same firms can shift between different market forms, depending on industry changes, competition, and innovation. It’s also not always easy to neatly categorize a company into a single structure - markets are messy, and firms often operate in a gray area between models.
Back to our original question: why does this matter for investors? Well, understanding market structures helps us identify moats - the competitive advantages that allow companies to sustain profits over time. Pricing power, product differentiation, barriers to entry - these are all potential economic moats that can make or break an investment. Knowing how market forces shape these dynamics gives investors an edge in spotting durable businesses with lasting advantages.
Coming up in Part II, we’ll explore two market structures that take competition to a whole new level - Oligopoly and Monopoly. But before that, we’ll take a quick detour on Friday and Sunday to break down the Great Financial Crisis of 2008 and take a closer look at the financials of our latest gem, Aris Water Solutions.
Thanks for reading, and hope to see you next time!
📢 Did this interest you? Let me know! I’d love to hear your thoughts - was this useful, too theoretical, or just right? Drop a comment or reach out!
🔔 Don’t miss the next articles - subscribe now! More deep dives are on the way, and you don’t want to miss Part II. Stay tuned!

