


[Part II] Market Structures & Their Impact On Economic Moats
Part II

Before we jump into today’s topic, let’s do a quick recap of the key ideas from Part I. Ultimately, understanding market structures is about understanding how sustainable a company’s moat is—how well it can defend its competitive advantage over time. The type of market a company operates in plays a huge role in determining how hard (or easy) it is to maintain that moat, and by extension, how hard it is to create long-term value for shareholders.
We’ll begin with the most technical bit—just to get it out of the way. Don’t worry, I’ll keep it short and as painless (and hopefully even entertaining) as possible:
Marginal Cost (MC): The cost of producing one additional unit of a good or service.
Marginal Revenue (MR): The revenue gained from selling one additional unit.
Average Cost (AC): The total cost divided by the number of units produced—a measure of cost per unit.
Average Revenue (AR): The total revenue divided by the number of units sold—essentially the price per unit.
With that in mind, let’s revisit the five key characteristics that help define any market structure (as introduced in Part I):
The number and size of suppliers
The degree of product differentiation
The amount of pricing power sellers have
Barriers to entry (how difficult it is for new competitors to enter)
Non-price competition (things like branding, advertising, or quality)
To save you time, here’s a quick refresher on two market structures we covered:
Perfect competition and monopolistic competition both feature many suppliers and low barriers to entry. The difference lies in product differentiation. In perfect competition, products are essentially identical—no branding, no uniqueness. In monopolistic competition, there’s a bit of differentiation, either through product features or non-price competition like advertising or branding. That gives firms a little bit of pricing power, but not much.
Today, we’re diving into the next two market forms—ones where the number of suppliers is limited: oligopoly and monopoly. We’ll start with the oligopoly, which is a bit more complex due to strategic pricing dynamics between competitors. After that, we’ll move on to the monopoly—much simpler to grasp, since it’s a market with just one dominant firm.
Grab a coffee and let’s get into it!
Oligopoly
Oligopolies—they’re everywhere. Seriously. They’re one of the most common market structures out there. As mentioned earlier, an oligopoly is a market dominated by a small group of players. Sometimes it’s built around marketable products (think soda or cereal), other times it’s all about commodities like oil—hello, OPEC.
What makes an oligopoly really interesting (and also a bit dramatic) is this: each player knows their move will trigger a counter-move. Especially when it comes to pricing. This makes pricing decisions interdependent—you don’t just decide your price in a vacuum. You strategize, anticipate, maybe even scheme. It’s chess, not checkers.
Before we dive into the juicy stuff—pricing strategies—let’s do a lightning round of the main characteristics that impact the strength (or weakness) of a firm’s moat in an oligopoly:
There are only a few sellers.
Products might be differentiated (like cereal), but don’t have to be (like oil).
Firms have decent pricing power—sometimes a lot.
Barriers to entry are typically high. No easy way in.
Non-price competition? Depends on the product. Cereal? Yes. Crude oil? Not so much.
Alright, onto the fun part—pricing strategies. Since pricing power is a big part of any competitive moat, understanding how firms actually use that power can be surprisingly useful for investors. But fair warning: in the wild, pricing strategies aren’t always crystal clear. That said, economists generally recognize three main approaches.
Pricing Interdependence

In this first strategy, firms aren’t just setting prices—they’re reading the room. Or more precisely, reading the market. Here’s the logic they follow:
If a competitor lowers their prices, you better lower yours too—or risk losing market share.
But if a competitor raises prices? Ignore them. Let them suffer the consequences.
Now flip it:
If you lower prices, expect retaliation.
If you raise prices, don’t expect others to follow.
This mental game leads to what economists call the “kinked” demand curve—not to be confused with something kinky (sorry, had to). Here’s how it works:
The blue section shows what happens if a firm increases its price. The curve flattens, because competitors won’t follow. Result? A painful loss in output as customers flee to cheaper alternatives.
The yellow section shows what happens when a firm lowers its price. Everyone else follows suit, which means the increase in output is tiny. The curve gets steep.
This kink creates a discontinuity in the marginal revenue (MR) curve. At the kink—known as the prevailing price—firms are stuck. Raising prices is bad. Dropping prices is also bad. So… they just hold.
In theory, output should be where MC = MR. But with the MR curve split at the kink, even if marginal costs move a little, the firm won’t budge. There’s no gain in changing price or output. This explains why prices in oligopolies tend to be sticky, even when costs shift.
The catch? No one really knows what the prevailing price actually is. It’s kind of a mystery, which brings us to something a little more straightforward…
The Cournot Assumption

Enter the Cournot model. In this version of the oligopoly game, firms assume other players won’t react to their output changes. Basically: “I’ll do me, and assume you’ll keep doing you.” No tit-for-tat here.
Each firm aims to maximize its own profit, based on the assumption that competitors will stay put. Over time, this stabilizes the market at a certain output and price level. Let’s imagine a duopoly—two firms, one market. If we know the overall demand, a bit of math gives us each firm’s optimal output. (Don’t worry, we’re skipping the math.)
What you need to know: the resulting output and prices land somewhere between a monopoly and perfect competition. Makes sense, right? An oligopoly isn’t a free-for-all like perfect competition, but it’s not a single-player game like a monopoly either.
The outcome? Deadweight loss—a.k.a. inefficiency. The market doesn’t produce at max potential, and consumers lose out. But for the firms? It’s not the worst place to be.
Still, the Cournot model assumes no one reacts, which in real life is… kind of naive. That’s where the final model takes things up a notch.
The Nash Equilibrium

Now we’re in Game Theory territory. And no, this has nothing to do with video games. In this world, firms make decisions based on what they expect their rivals to do. Every player is trying to stay one move ahead.
A Nash Equilibrium occurs when no one can benefit from changing their strategy—given what everyone else is doing. Let’s walk through an example from Figure III:
Start in the top-left. Both Firm A and Firm B raise prices. Firm B realizes it could do better by lowering its price (jumping from £20M to £24M in profit). Now Firm A’s payoff drops, so they react by lowering their price too. That gets them to £15M. At this point, if either firm makes another move, they lose money.
So we’ve hit the bottom-right corner: the Nash Equilibrium.
The irony? If both firms had just cooperated and kept prices high, they’d both be making £20M. But trust is hard to come by in competitive markets. Which is the perfect transition into…
Cartels & Stackelberg
When firms do manage to cooperate, we call that a cartel. And yes—it sounds way cooler in a movie. Cartels agree to keep prices high, artificially inflating profits well above what a normal oligopoly would allow.
Problem is: cartels are illegal in most countries. They hurt consumers and stifle fair competition. The one notable exception? OPEC. Its members agree on strict production quotas to control oil prices and rake in the profits.
But cartels are fragile. All it takes is one rogue member to undercut prices, and boom—the whole thing falls apart. That’s why successful (secret) cartels need:
Few, similarly sized firms
Homogeneous products
Aligned cost structures
Frequent orders
Strong retaliation
Minimal external threats
Spot the OPEC resemblance?
And finally, we have the Stackelberg model, a.k.a. the Top Dog approach. One firm—the leader—sets the price. Everyone else follows. Trying to start a price war with the top dog? Not smart. They’ve usually got a cost advantage and deeper pockets. They’ll outlast you in a price war, and you’ll crawl away bruised. Or bankrupt.
That’s a wrap on oligopolies. I know—it’s a lot. Let it simmer. If there’s one key takeaway, it’s this:
The optimal strategy of a firm depends on what the competition is doing.
Next up? Time to dive into the (relatively lonely) world of monopolies. Let’s go.
Monopoly
Remember that one game where friendships ended and board pieces flew across the room? Yep, Monopoly. The name says it all. The goal: buy everything, crush your enemies, and become the sole ruler of the board. That, in essence, is what a monopoly is: a market structure ruled by a single supplier.
And just like in the game, the rules of a monopoly are pretty straightforward:
There’s only one supplier.
No room for product differentiation—you’re the only show in town.
Massive pricing power.
Barriers to entry are sky-high. Think Mount Everest, but with legal teams and patents.
Non-price competition? Yeah, no need. You're not competing with anyone.
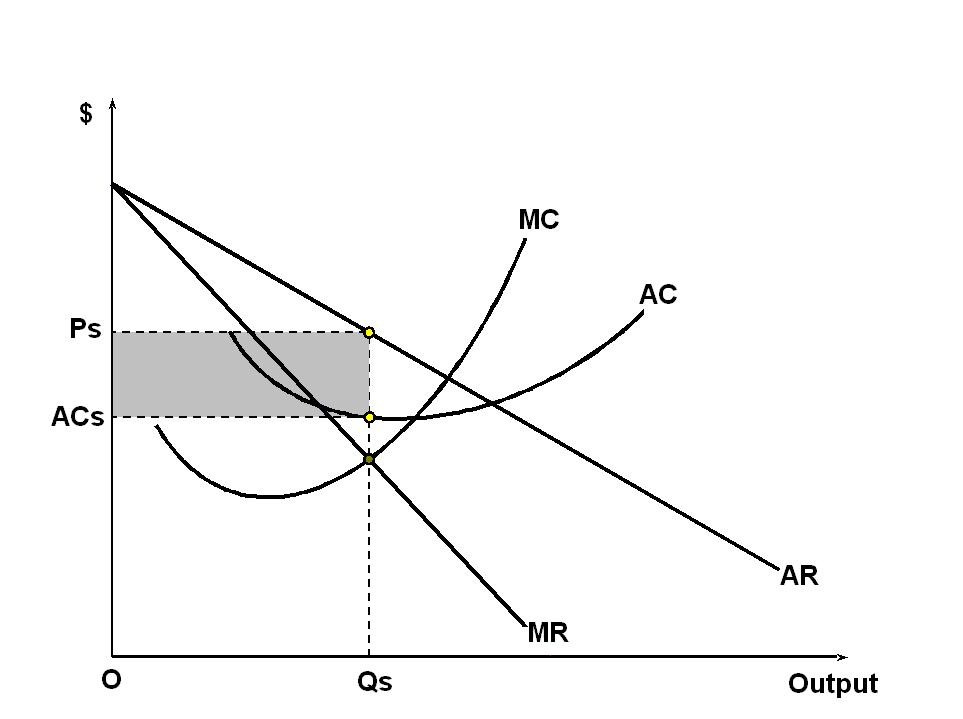
Take a look at Figure IV for the economic dynamics. Just like in other structures, the optimal output and price are found where MC = MR. In larger markets, thanks to economies of scale, marginal costs tend to be lower, which pushes the optimal output higher than in smaller, niche markets.
If you've got a sharp memory, you might’ve noticed this graph already made a cameo last week in our monopolistic competition section. That’s not a mistake—it’s intentional. In fact, the short-run equilibrium of monopolistic competition looks a lot like the long-run equilibrium of a monopoly. The big difference? In monopolistic competition, other players sniff out your profits and crash the party. In a monopoly? No one's invited. So that sweet economic profit? It sticks around.
From a consumer’s perspective, monopolies are usually bad news. Less choice, higher prices, and a big ol’ chunk of the market controlled by one firm. Case in point: remember when the U.S. sued Facebook for gobbling up Instagram and WhatsApp? That’s the danger of becoming too dominant.
But—flip the coin—from an investor’s point of view, this is dream territory. A monopoly is the ultimate moat. Even better? A quasi-monopoly: a firm that dominates its market, but just enough to stay under the regulatory radar. Of course, once investors catch on, the secret doesn’t stay secret for long—and the price adjusts accordingly.
And with that, we’ve wrapped up our tour of market structures. From free-for-all perfect competition to one-player-only monopolies.
Before I let you go, just a few parting thoughts in our now-traditional closing remarks…
Closing Remarks
Let’s wrap things up.
The big takeaway from all this? Understanding market structures helps you recognize moats—and more importantly, how sustainable they are. The more you understand the environment a company operates in, the better you can judge how durable its competitive edge really is.
That said, let’s not pretend this is a perfect science. In practice, it’s often hard to pinpoint exactly which market structure a firm operates in. Real-world markets don’t fit neatly into textbook categories. They’re dynamic. Competition ebbs and flows. Barriers to entry rise and fall. So rather than fixed boxes, think of market structures as a spectrum—fluid, evolving, and shaped by constant change.
Also, the goal here isn’t to turn you into a walking economics textbook who dreams about marginal cost curves. This series is meant as a framework—a way to think intuitively about different market forms and how firms naturally fall into them based on their environment. It’s an illustrative support, not a final exam.
Next up? We’re taking a sharp turn into history with Part II on the Great Financial Crisis—where we’ll break down the key players and the instruments involved. And on Sunday, we’ll return to our ongoing financial analysis, with the spotlight back on Aris Water Solutions.
Thanks for sticking around—and as always, see you next time!
📢 Got thoughts? Drop a comment below—always curious to hear how you think about market structures or if you’ve seen some of these dynamics play out in real companies.
🔔 Don’t miss out. Subscribe to get the next posts straight in your inbox—especially as we dive deeper into valuation techniques and real-world analyses.
Please note: This article includes a disclaimer regarding investment advice.
Our Recent Posts
Aris Financial Health Check

Alright, folks, we've spent weeks diving into the qualitative side of things—context, strategy, market positioning. But now, it's time to roll up our sleeves and get into the hard numbers. Because, let’s be honest, a company can spin a great story for investors, but does Aris actually have the financials to back it up? That’s what we’re here to find out.

Market Structures & Their Impact On Economic Moats

Imagine strolling through a bustling outdoor market. Vendors are calling out their best deals, colorful fruit is piled high on wooden carts, and the air is filled with the smell of fresh bread and roasted coffee. As you weave through the crowd, something catches your attention - two different stalls selling the exact same apples, but at different prices…