


The Value In Real Estate
Valuing & Selecting A REIT

Recently, we wrote an article which covered the opportunities in data. We discussed how AI and Cloud Computing could be major drivers for data center growth. There was, however, one important catalysator: Moore’s Law. Or rather, the lack thereof. I will not repeat myself too much — so if you’re interested, make sure to go check out our previous article on this!
In the end, it came down to the point that we were looking for an undervalued data center REIT. Because of a variety of reasons, a REIT seems more interesting than a company that just provides data servers. Anyway, armed with a lot of coffee, I went on my search. Ready to read, measure and ultimately decide on a top 10. From that top 10, I’d take the most important fundamental measures. Finally, I’d do what I do best: quantatively compare my top 10, and pick the ultimate winner for a deep-dive in a next article. It would have been beautiful.
Would have been.
Twenty minutes into my search, I realized that there’s very few publicly traded data center REITs, especially in dollars. In fact, there’s only two:
Equinix - EQIX 0.00%↑
Digital Realty Trust - DLR 0.00%↑
In Singapore, there’s also Keppel DC REIT, and in Hong Kong a holding called GDS Holdings. These are options too, but listed in respectively Singaporian dollars and Hong Kong dollar, I’m not directly jumping at these. So, only two significant data center REITs that are publicly traded.
Change of plans.
Instead of comparing them on a few fundamental metrics, I’ll do a deeper financial analysis on both. However, the main purpose of today’s article still remains to teach you something on how to value real estate. So, that makes two simple goals today: (1) showing how I would value a REIT - Equinix in today’s article, and (2) gathering some useful financial metrics so a comparison with Digital Realty Trust next is possible. After that, I’ll also touch on some qualitative aspects that differ between these two firms. This way, you get two deep-dives for the price of one. Talk about a good investment!
I’d highly recommend you arm yourself with some coffee as well, and let’s dive in!
Funds From Operations - FFO
FFO = Net Income + Depreciation & Amortization - Gains on Sale of Assets
The FFO of a REIT can be roughly compared to the EBIT (Earnings Before Interest & Tax) for a “normal” firm. This metric tries to measure how much operational cash a REIT generates. In the end, this asset class is supposed to have the same characteristics as regular real estate, so the funds generated from renting it out are key.
The FFO in itself is usually calculated by the firm itself. However, be careful, as this is a non-GAAP - so self-reported - measure. You probably understood the following by now: the higher this metric, the better. In the case of Equinix, the reported FFO is the following:
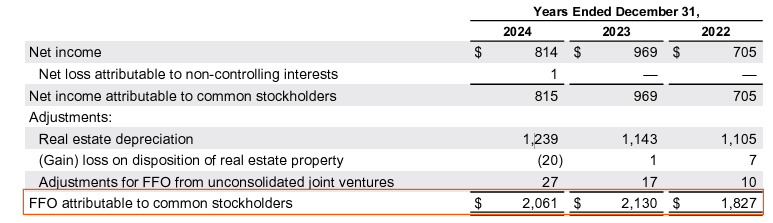
Last year, the FFO has slight declined - by approximately 3%. However, in 2023, there was an incredible growth of 16,6%. These growth rates are something important to be checked against Digital Realty Trust in our next analysis. If growth rates are more or less the same for both, we can assume that the data center REIT sector has been uplifted or hit as a whole. If this is not the case, we need to find a reason why one REIT is outperforming the other. It’s a basic comparison, but it remains fundamental to understanding assets.
Next, the FFO can also be measured against other measures. The most robust comparison would consist out of an FFO/Revenue measure. FFO/Revenue could give an indication over time on the efficiency of a REIT. If this metric is becoming higher, it implies more efficiency.
Be, however, careful in comparing between REITs, as revenue streams often differ in their characteristics. The FFO/Revenue is impacted by both the operational and financial costs. This implies that firms with different capital structures - and different does not mean better or worse - can have a different FFO, even if their operational efficiency is more or less the same. Therefore, use this one wise, and preferbably within a REIT over time.
For Equinix specifically, the revenue is equal to $8,748, a growth of 6% in comparison to last year. However, the FFO/Revenue has declined from 26% in 2023 to 23,5% in 2024. This can be indication that the operational efficiency has slighly declined, or just bad luck. Anyway, it’s something to keep in mind when performing our qualitative analysis.
Adjusted Funds From Operations - AFFO
AFFO = FFO – Capital Expenditures – Straight-lined Rent Adjustments
As the calculations show above, the AFFO goes a step further into measuring the actual cash flow. You’re probably familiar with Capital Expenditures. However, the last term might seem a bit strange. The straight-lined rent adjustments - without going into too much detail - is a correction on the matching principle in accounting. The matching principle states that costs and revenues should be recognized in the period they belong to. This means that if a 10-year contract has expected rent payments of $100,000, the REIT should recognize $10,000 every year - no matter the actual cash payments. Another - probably more familiar - example is the famous depreciation. If an asset worth $50,000 is expected to be useful for 5 years, $10,000 should be recognized - or depreciated - yearly. In the AFFO, this matching principle is temporarily abonded to get a better view on the actual cash flows for that year.
AFFO gives the investor a good idea of how much cash is available for distribution among shareholders. Again, most REITs provide this metric themselves as a non-GAAP metric. For Equinix, the following AFFO was reported:

It’s clear that this AFFO has been growing over the last couple of years. In both 2024 and 2023, the AFFO has grown 11% YoY. The following graph shows that this growth has persisted over the last couple of years, at a CAGR of 11%. The adjusted EBITDA is also given as a comparison metric.

For the AFFO, an interesting ratio is the AFFO per share. As explained before, this is the potential payout shareholders could have. In the previous article, I explained that regulation forces REITs to pay out at least 90% of their taxable income to shareholders. Hence, a large portion of this potential payout will eventually flow back to investors in the form of dividends. In February 2025, Equinix had 97,332,005 in common shares outstanding. This implies that the AFFO per share stood at approximately $34,5 ($3300 M / 97,3 M). At the current price of $876, this gives a potential dividend yield of about 4%.
This metric should always be looked at together with the actual dividends paid out. As dividend yield is not a REIT-specific metric, I won’t be tackling it here. If you want to find out more about dividend yield, I’d recommend you take a look at our previous deep-dives and breakdowns, in which we cover this topic.
Finally I want to remark that this AFFO is the measure we’ll be using for our valuation in a later stage. For REITs, it gives a better estimate of cash flows than the FCFF used for “regular” asset valuations.
Net Asset Value - NAV
NAV = (Market Value of Assets – Liabilities) / Total Outstanding Shares
In the jungle of REIT metrics—where AFFO reigns, FFO shouts loudest, and dividend yields flash like neon signs—there’s one old-school tool that still deserves your attention: Net Asset Value (NAV).
Think of NAV as the “what if” metric.
👉 What if the REIT sold everything it owns, paid off its debts, and handed the leftovers to shareholders? That’s your NAV.
👉 And what if you divided that pile by every share in existence? That’s your NAV per share—the price tag on what you actually own.
Sounds basic, right? But here’s the kicker: NAV still works like a compass when the market gets cloudy. It won’t scream “BUY ME” like a hot growth story, but it will whisper, “Hey… this stock’s priced way above (or below) its real estate.”
Now, let’s spice it up with our real example: Equinix.
From their latest financials:
Total Assets: $10.05 billion
Total Liabilities: $3.91 billion
Net Asset Value (NAV): $6.14 billion
Shares Outstanding: 97.33 million
Crunch the numbers, and you land at:
🎯 NAV per Share = $63.05
That’s right—every share of Equinix carries about $63 of real-deal, hard-asset backing.
Now, if the market price is $800+ (as it has been), you’re not buying Equinix for its book value—you’re buying into its growth engine, its moat, and its role in the AI boom. But if that price ever drifts closer to NAV? That’s when the value sharks start circling.
Final Remarks
As you might’ve noticed, we didn’t cover the usual suspects like P/E ratios, ROE, or debt ratios in this one—and that was entirely intentional. This piece was never meant to be a generic checklist. It was a pure REIT-style financial deep dive, laser-focused on metrics that actually matter when you’re valuing a data center REIT.
A word of caution, though: most of what we worked with—FFO, AFFO, even AFFO per share—are non-GAAP metrics. They’re industry-standard, but not standardized. Always stay alert to the assumptions baked into the numbers. If it sounds too smooth, dig deeper.
And while this may have felt like a full valuation journey, it’s really only part two of the story. A story not just about numbers, but about how those numbers stack up between players. This week was all about Equinix. Next week, it’s Digital Realty Trust’s turn. Same structure. Same metrics. Same black coffee. And once we’ve got both on the table? Then we can actually compare, contrast—and maybe even crown a winner.
If you’re wondering what led us down this rabbit hole in the first place, it was simple: we were looking for a standout data center REIT—something potentially undervalued in a sector bursting with AI buzz, cloud growth, and digital transformation. A REIT, not just a server provider. Why? Because we think the real value sits beneath the concrete, locked into long-term contracts, power redundancy, and irreplaceable locations.
And yes, if you're curious about how conviction changes even within the same investor: go check out Milan’s recent Tesla sale. It’s a fascinating reminder that no holding is sacred—and that portfolio choices can shift radically when the narrative starts to diverge from reality.
Until then, thanks for reading, and see you next week for part two.
This time with DRT. And probably more caffeine.
📢 Where do you stand on Equinix at current valuations? Drop your thoughts in the comments—we love reading other investors' perspectives.
🔔 Next week, we’ll break down Digital Realty Trust and compare it side-by-side with Equinix. If you don’t want to miss it, make sure you’re subscribed.
Please note: This article includes a disclaimer regarding investment advice.
Our Recent Posts


Is Amazon Undervalued?

With a slight delay (blame Aris), we've finally arrived at the final — and arguably most exciting — part of our Amazon deep dive: