Imagine trying to figure out what a company is actually worth in today’s wild markets. It’s like trying to predict the weather a decade from now—not impossible, but you better be prepared to make a lot of educated guesses along the way! For companies with serious growth potential, like Edenred, the Discounted Cash Flow (DCF) model is the go-to tool for valuation. Now, this model might sound a bit like financial sorcery, but it’s really based on a simple principle: an asset’s worth is just the sum of all the cash it will generate in the future—with a bit of a discount for waiting.
But here’s the twist: using the DCF isn’t as easy as pressing a few buttons. Every assumption you make—about growth rates, profit margins, or the big “discount rate”—shifts the final value. And with companies like Edenred, how you tweak these assumptions can totally change your view of its future and whether it’s worth your investment dollars.
Our assumptions are all about the story behind Edenred, which you’ll find in this article. Here, we dive into the company’s “moats”—those unique advantages Edenred has—and how these shape our expectations for revenue growth and EBIT margins. Plus, we’re working with the idea that Edenred’s main strategy is growth through acquisitions. Want to know the details behind this assumption? This article lays out the whys and hows, so you’ll see exactly what’s driving our thinking.
The DCF Model & Its Key Ingredients (Think of it as Cooking with Cash Flows)
The DCF model boils down to this: How much are Edenred’s future cash flows worth today? Just like a recipe, each ingredient here—growth rates, profit margins (EBIT margins if we’re being fancy), and reinvestment rates—affects the final flavor of the valuation. And just like a hint of spice can make or break a dish, the discount rate is crucial, as it reflects the risk level. The higher the risk, the higher the discount rate, basically saying, "I could invest this money elsewhere, so show me the rewards!"
The DCF splits into two big growth phases:
High-Growth Period: The “honeymoon” phase where companies, including Edenred, go full speed ahead, growing revenues fast and boosting margins.
Stable Period: Where things settle down, and growth becomes more modest. Here, we expect Edenred to diversify its revenue sources—good for stability but also a breeding ground for competition, which could shrink those margins.
Base, Bear, and Bull Cases: Charting Edenred’s Future
Predicting Edenred’s performance isn’t just a one-scenario game. By laying out Base, Bear, and Bull cases, we can see how Edenred might play out across best, worst, and in-between scenarios. Each is like a different path through the financial woods.
We opted to use the DCF model in a non-traditional way. Normally, you would estimate the company’s future free cash flows (FCF) and discount them using either the WACC or, as we often do, the minimum return you want from your investment. This provides an estimate of the company's current value, allowing you to see if it’s higher or lower than the market value.
For Edenred, however, we took a different approach: after estimating the FCFF, we adjusted the WACC until the calculated value per share matched the current market price. This allows us to determine the expected return in each of the three scenarios we developed.
Base Case
This is the middle ground, aligned with Edenred’s own forecasts. We found it reasonable to use management's targets for our base scenario, as they have historically been successful in meeting their own expectations.:
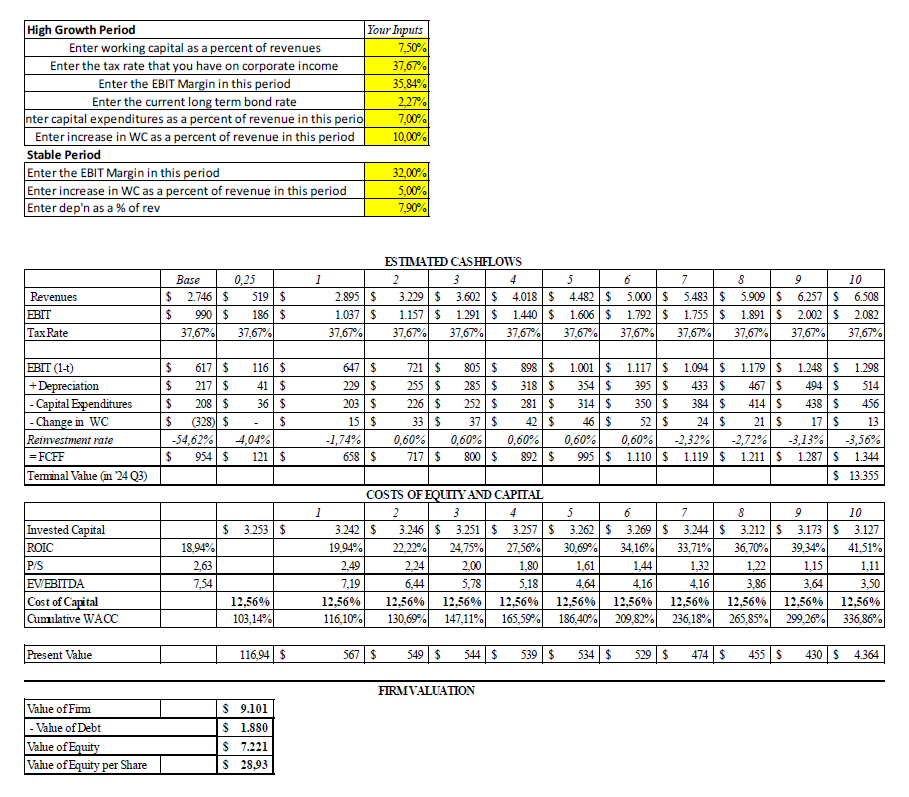
High-Growth Period: A solid 11.55% revenue growth, targeting about $5 billion by 2030, as in line with their own goals. Their business moats—think legal protections, economies of scale and network advantages—keeps the EBIT margin high at 35%. We decided not to project further margin increases, even though this trend was evident in the past as revenue grew. We believe it’s better to take a conservative approach in valuations.
In this scenario, we’re looking at a reinvestment rate close to 0%, thanks to a balance between Depreciation & Amortization (D&A) and capital expenditures. Why? Because we’re assuming Edenred’s growth is acquisition-driven, and acquisitions typically bring a hefty dose of amortization along with them. In terms of numbers, we’re estimating that D&A will stick around 7.9% of revenue—a ratio based on this year’s figures—while the capital expenditure rate will sit at 7%, aligning with Edenred’s own forecasts.
Then, there’s the thorny issue of working capital increases. For simplicity, we assumed every uptick in revenue brings a 10% increase in restricted cash. In other words, for every $100 in additional revenue, Edenred would need to set aside $10 in restricted cash. Admittedly, it’s an odd assumption, and it wasn’t an easy one to settle on. Out of all the assumptions here, this was the trickiest and has the weakest grounding in hard data.
Stable Period: Growth slows to 4%, and margins nudge downward to 32% in year ten as we assume that competition will heat up.
In the stable period, we’ve tweaked the reinvestment rate down a notch due to a slower rise in working capital. Here’s the reasoning: we’re assuming only 5% of revenue will need to be set aside in restricted cash. Yes, it’s a bit of an oddball assumption, but the idea is to balance out the likely scenario where, in at least one of these years, working capital might actually decrease, giving cash flow a little boost. To account for that possibility, we’ve lowered the restricted-cash-to-revenue ratio for those final five years.
Discount Rate: Around 12.56%. At this price, investors would expect a healthy 12.56% return, balancing growth expectations with risk.
Down below you can see how our DCF looks for the base case scenario:
Bear Case
Here, we take a more cautious view:
High-Growth Period: Revenue growth dips to 7%, hitting $4.1 billion by 2030. EBIT margin edges down to 32.5%, expecting that some of Edenred’s moats weaken or don’t even keep existing.
In this scenario, the reinvestment rate edges up to 2% due to a bump in both capital expenditures and the restricted-cash-to-revenue ratio. This slight increase means Edenred is putting a bit more back into the business, driven by these higher capital needs and a bit more cash being set aside as revenue grows.
Stable Period: Further slowdown of revenue growth to 3%, with margins (EBIT-margin of 30%) facing more pressure. In the stable period, the reinvestment rate ticks up slightly compared to the base case, reflecting the need for more gross reinvestments in capital expenditures (CapEx) and working capital (WC). This adjustment means Edenred is allocating a bit more to maintain steady growth and support ongoing operations as the business matures.
Discount Rate: An expected 10.02% return, reflecting the added risk.
Bull Case
The optimistic outlook if Edenred outperforms:
High-Growth Period: Revenue skyrockets at 15%, with a potential $6.4 billion by 2030. Moats and scale effects keep the EBIT margin strong at 40%. In the bull case, the reinvestment rate actually dips during both the high-growth and stable periods. Why? Because Edenred’s growth here is more efficient, needing less capital to fuel expansion. This means that, even as the company scales up, it can achieve its ambitious growth targets with lower reinvestment in both CapEx and working capital, freeing up more cash flow along the way.
Stable Period: Growth slows to 5%, with a modest margin dip but still solid.
Discount Rate: A return of 15.82% here would be a dream come true for most investors.
Looking Under the Hood: Business Lines and Expected Returns
Digging deeper, Edenred’s growth across business lines reveals some big shifts. By 2025, Business & Expenses (B&E) will make up 56% of revenue, with Mobility solutions trailing at 26%. Fast forward to 2030, and B&E decreases to 52% as Mobility climbs to 28%, showing Edenred’s push for diversification. All of this gives us a baseline return of around 12.38%—not too far from the base case.
Some Fine Print: Don’t Forget the What-Ifs
DCF models are helpful, but keep in mind: they rely on assumptions, and assumptions can be tricky. With Edenred’s expansion strategy relying heavily on acquisitions, separating organic growth from growth-by-buyout can be a pain. Plus, any shifts in political or regulatory landscapes could impact Edenred’s legal protections, throwing another wrench into the competitive mix.
So, while the base case seems safe, it’s always worth asking: are these forecasts trustworthy? Whether you’re betting on the base, banking on the bull, or bracing for the bear, Edenred’s future depends on more than just numbers—it’s about whether the company’s story and strategy fit your own investment goals and appetite for risk.
If you're interested in the Excel file we used to create all the DCF models—and that also includes additional valuable insights about Edenred—make sure you're subscribed and send us a direct message!
A quick note: This isn’t investment advice—just some food for thought!


