


A Valuation Framework for Financial Institutions - Part II
The Income Statement
⏳ Quick Reminder: Last Chance for Discount!
Our early supporter discount on the premium subscription ends July 1st. If you’ve been considering joining, now’s the time to lock in 60% discount.
Last week, you were introduced to the world of financial institutions. In Part I, the background, business model and differences with non-financial companies were highlighted. It became clear that banks aren’t (just) the greedy corporate monsters they sometimes are depicted to be, but actually operate in a relative simple way. Consider capital as the product they buy and sell, and the business model becomes rather straightforward: buy capital from people that have too much, and sell it with a margin to the people that have too little.
Of course some differences exist. In the banking sector, a handful of players dominates the market. As their services are used so often, and by so many other agents in the economy, bankruptcy can pose a real risk when dealing with these banks. Hence, banks are monitored very closely by dedicated governmental institutions, often central banks. Secondly, banks are very sensitive to interest rates, as the buying and the selling price of capital - interests paid out and coming in - heavily depend upon these rates. Additionally, banks have one main advantage: they can create capital out of nothing. Due to how the system evolved over the years, banks only keep a fraction of the money they lend out on their balance sheets. This is called leverage. And banks love it.
Today, the focus is on how banks make and spend their money. By looking at the financial statements of J.P. Morgan Chase - I tend to learn best by real-life examples - I’ll try to explain how an income statement of a bank looks like. How do banks generate money? Is it true that all income goes to insane bonuses for the vice presidents? What if interest expenses become higher than interest income?
Today, there will be an answer to all these questions - except for the one on bonuses, I try to avoid getting sued.
You know the drill by know: grab yourself a coffee, sit back, and enjoy this break-down of banking income statements!
The Basics
First of all, let’s take a look at a simplified income statement, representative for a bank:
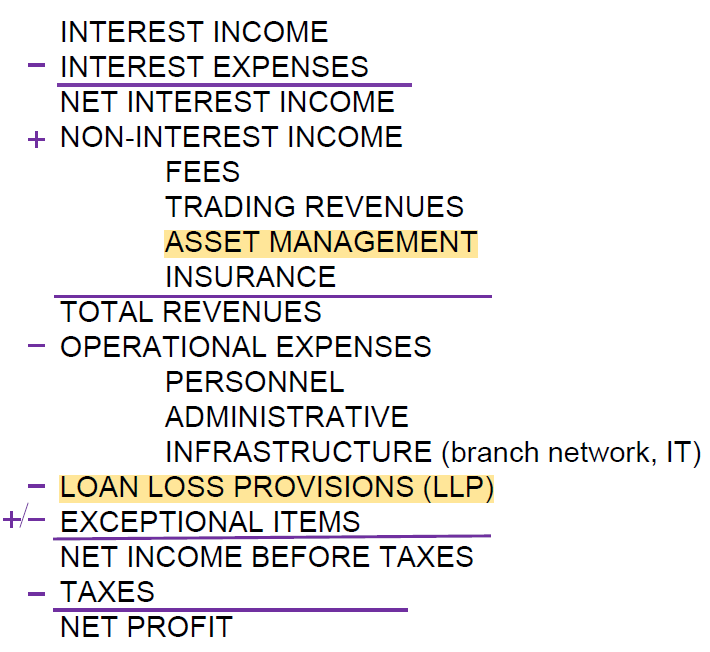
As you can see, the total revenue consists out of two main elements: Net Interest Income (NII) and Non-Interest Income (NONINT). The NII is simply the difference between the interest that is received, and that is paid out. The NONINT, on the other hand, is composed of a few other income streams, which will be discussed later on.
The total costs are also a combination of (mainly) two aspects: the operational costs and the Loan Loss Provisions (LLP). The operational costs are of the same kind like those in any other company. These are needed to let the business run smoothly. The lower these costs are, the more efficient a bank operates, the more profit will be on the bottom line. Then there’s also a very bank-specific cost: Loan Loss Provisions, explained in-depth as well later in the article.
The last two lines to complete the income statement are also relevant to any other firm: the one-off gains or losses and, always present, taxes.
Now that the structure of a banking income statement has been laid out, let’s dive a level deeper. By using the Annual Report of 2024 of J.P. Morgan Chase, I’ll show what this looks like in practice.
What Comes In
On the income side, the NII and NONINT are the major players. The NII is, as previously mentioned, the difference between the interest income and the interest expenses. Interest income is mainly generated from giving out loans. The interest income depends on a lot of factors, but the main one is interest rates. Let me explain.
The higher the base rate - the rate determined by a central bank - the higher the rates charged for giving out loans. A simple relationship that will always be respected by the banks. Why? Well, banks have to get their capital somewhere too. I’ll discuss the in-depth structure of banking capital in a next part, but for now I’d like to highlight two things: deposits and interbank loans.
Deposits are the most obvious one. People put money on their savings accounts, against which banks can give out loans. For this capital, the depositors get a compensation, in the form of interest. An interest expense for the bank. The higher this compensation, the more people want to put their money in the bank, the more loans can be given out. This, in turn, leads to more interest income.
Secondly, there’s interbank loans. Banks not only give out loans, they need them as well. It’s a more predictable and stable form of capital than deposits, which can fluctuate quite a bit. Banks can get these loans either from other banks, or the central bank. And at what rate will the central bank charge the banks? That’s right. The base rate mentioned before. This implies that a higher base rate translates into higher rates on outgoing loans. A well-respected relationship.
The second part of revenues comes from Non-Interest Income. First of all, there’s fees. Banks will charge a small yearly fee. A few billion small fees quickly adds up to big number. Then there are other services, such as Asset Management and Insurance, offered by the bank - of course for a small fee. Additionally, there’s also the revenues from Trading and other activities related to this.
That’s the theory. Let’s put it in practice by looking at these aspects in the income statement of J.P. Morgan Chase:

As you can see, there’s a lot of fees. A small cut for their services that ends up on their income statement. The main sources of revenue are very clear as well: Principal transactions, Asset management fees and NII. Principal transactions are composed of trading revenues, but also market-making activities. The Asset management fees represent a significant portion of the NONINT as well, and have been increasing over the last few years. There’s also the NII, the main portion of the revenues. From 2022 to 2023, these have increased substantially - a combination of higher base rates and relatively stable deposit rates.
Of course, not everything stays in the bank. Let’s take a look at what goes out, and - more imporantly - on what it has been spent.
What Goes Out
On the other side, there are expenses. These consist on the one hand out of pretty standard stuff: salaries, services, technology, etc. On the other hand, there’s the Loan Loss Provision (LLP) which is very specific to the banking sector. Let’s take a look at the cost structure of J.P. Morgan Chase, and analyze it a bit closer:


A lot of the operating expenses are made out of salaries, either to employees or external services. Another expense that immediately stands out are the expenses made on technology - about 10% of total operational expenses. Why? Digitization. To keep customers, banks need to improve customer experiences. A straightforward way to do this is by improving how convenient it feels to use the bank’s services. A one-in-all app that allows you to look at your account(s), loans, and other services is a must these days. It also allows banks to upsell much more easily. Based on your income- and spending habits, banks can easily propose the perfect investment portfolio, loan, or insurance for you. Of course in exchange for a small fee.
Then there’s also the LLP. In simple terms, the money that is set apart to cover for expected loan defaults in the future. Based on models that take into account a lot of parameters, banks try to estimate the value of loans that will default in the coming year. Again, there are two major aspects here: (1) the macro environment and (2) the risk profile of the bank. The macro environment is a rather obvious one. The worse the economy is, the more firms and people will default on their loans. Firms lose business, people lose jobs, and can’t afford to pay back anymore. A second important aspect is the risk profile of the bank. When giving out loans, banks have essentially two options. They can play it safe and lend capital to trustworthy people at a lower interest rate, but a low default rate as well. Or they can take on riskier loans, with a higher interest rate, and higher default rates. Often, a mix is made to diversify the bank’s portfolio somewhat.
Either way, both the macro-economic environment and the risk profile are reflected in the LLP. The higher the LLP, the worse a bank expects the economy to become, or the more they shift towards riskier loans. Why exactly they would do that, I’ll explain in a next part.
Finally - to finish this (lenghty) article - I want to quickly highlight the cost-to-income ratio. This measure is exactly what it sounds like: it looks at the operational costs relative to the income. It’s a measure often used in the EU Area to look at how efficient a bank performs, and central banks tend to keep track of this in aggregate as well. In the US, similar measures exist, but are called a little differently - “overhead ratio” for J.P. Morgan Chase specifically. For our example, an overhead ratio of 51% is measured. To compare, take a look at the average EU cost-to-income ratio:
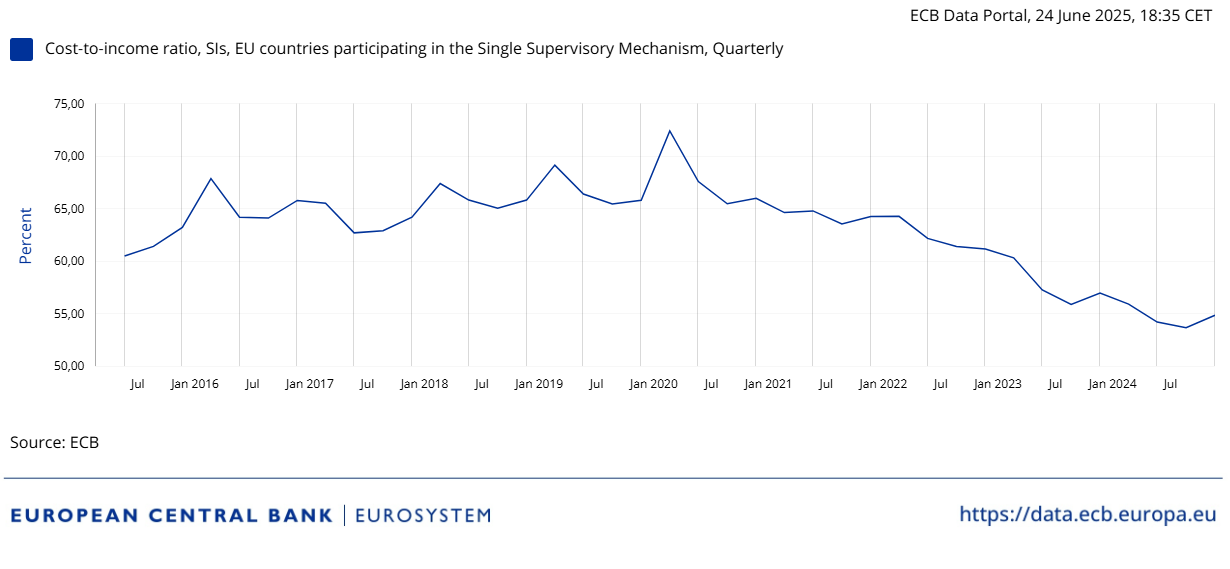
Right now, the average cost-to-income ratio is around 55% for European banks, after peaking during Covid.
All in all, a job well done by J.P. Morgan Chase in terms of efficiency.
Closing Remarks
To recap briefly, banks generate revenue through Net Interest Income (the spread between interest earned on loans and interest paid on deposits or interbank borrowing) and Non-Interest Income (fees, asset management, trading activities, etc.). On the cost side, they face Operational Expenses (staff, technology, services) and Loan Loss Provisions (reserves against expected defaults). These income and expense streams are driven primarily by interest-rate movements, the macro-economic environment, and each bank’s risk appetite and investment in digitization.
Next week, we’ll turn our attention to the balance sheet, delving into the asset side and exploring how banks generate returns on their holdings. And don’t forget: on Sunday, we’ll continue our deep-dive into the Ingredients sector, uncovering more insights and trends.
Thank you for reading, and see you in the next installment!
📢 Join the Conversation
What surprised you most about bank income and expenses? Drop your thoughts below!
🔔 Stay Updated
Enjoyed this deep-dive? Subscribe now to get next week’s balance-sheet breakdown straight to your inbox!
Please note: This article includes a disclaimer regarding investment advice.
Our Recent Posts
Who Deserves the Deep Dive? You Tell Us

Last week, together with Ozeco, we dove into the world of ingredient companies. Yes, I know — that sounds painfully boring. But hear me out.

