


Melexis - Part III
A Financial Health Check


In our ongoing exploration of Melexis, we've already taken significant steps to understand this fascinating company. In Part 1, we explored what Melexis does, focusing on qualitative assessments to better grasp its position in the market. Then, in Part 2, we shifted our focus to the risks associated with the company, painting a more balanced picture for potential investors.
Now, in Part 3, it's time to delve into the numbers and examine the company's financial health. This phase of our analysis will help us understand the strength of Melexis' foundations, not just through its balance sheet but also by evaluating key financial metrics like solvency and liquidity.
This approach also serves as a practical exercise. A few blog posts ago, Cas expertly outlined the theory of reading a balance sheet, income statement, and cash flow statement. With that knowledge in hand, we're applying those principles to Melexis, providing real-world insights that you can use to make more informed decisions.
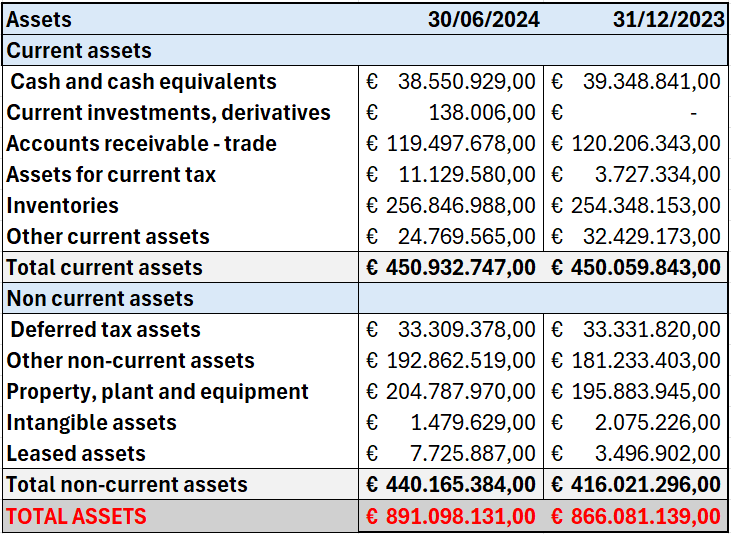
We’ll begin by diving into the balance sheet, the cornerstone of any financial analysis. For this, we’ll be using the most recent data available—the balance sheet as of 30/06/2024, but also the balance sheet of 31/12/2023 as the half year report doesn’t always contain all the data we need. These snapshots of the company’s assets, liabilities, and equity will give us a clear sense of Melexis’ financial stability and its ability to weather challenges or capitalize on opportunities.
We really recommend reading our second part on Decoding Financial Statements as it will give you a basic understanding of a balance sheet.
Trust me, you’re going to need it.
Starting with Assets
To kick off our analysis, we’ll focus on the assets section of the balance sheet. The first step here is to identify which asset classes are significant and warrant a deeper dive. For Melexis, these include trade receivables, inventory, property, plant, and equipment (PPE), and other non-current assets. These are the areas where meaningful insights can be uncovered.
It's important to note that if you’re serious about investing in a company, you should take the time to understand everything on the balance sheet—not just the big-ticket items. We always do this when dissecting a company, but to keep this post from turning into a novel (and, let’s be honest, because writing out every detail is a lot of work), we’re zooming in on the most critical areas today. Consider it efficiency, not laziness... or at least that’s our story!
Trade Receivables
Our first focus within the assets section is on trade receivables. To evaluate this area effectively, we’ll apply two key analyses:
1. Days Sales Outstanding (DSO): This metric measures the average number of days it takes for Melexis to collect payments from its customers. It’s a crucial indicator of how efficiently the company manages its credit and collections process. The formula for calculating DSO is:
DSO = (Trade Receivables / Total Sales) × Number of Days
A lower DSO generally suggests that the company is collecting payments quickly, which is positive for cash flow as it ensures the company has more readily available funds to reinvest in operations, meet short-term obligations, or seize growth opportunities. And let’s be honest, it’s always more fun to get your money sooner rather than later. We all hate that friend that never pays you back on time.
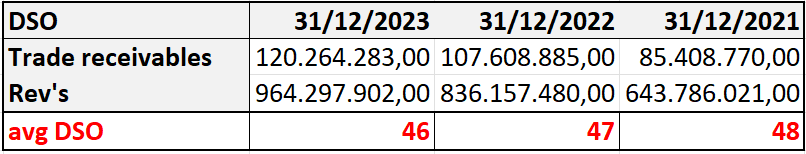
Melexis demonstrates a strict and clear policy towards its customers, as evidenced by its average days sales outstanding (DSO) remaining stable at around 47 days. While this number cannot be considered exceptionally low, it is not alarmingly high either. The stability suggests that there is little reason for concern in this area. However, it is still advisable to perform a second test: the ageing analysis.
2. Ageing Analysis: Here, we’ll break down the trade receivables based on how long they’ve been overdue (e.g., 0-30 days, 31-60 days, etc.). This helps us identify if there are significant overdue payments that could pose risks to the company’s cash flow and overall financial health.
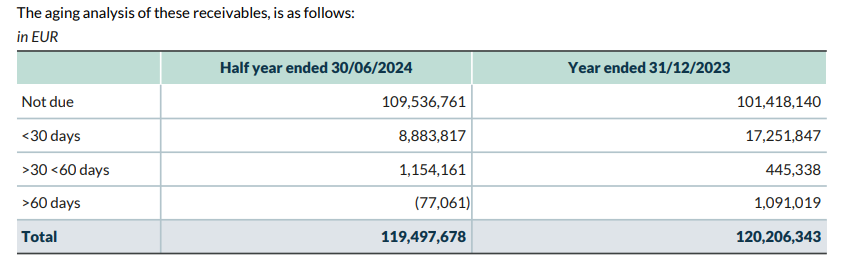
Fortunately for us, Melexis provides these types of analyses in their financial reports. Let’s face it—why do the heavy lifting when someone else already has? Consider this a win for efficiency, not laziness!
A quick glance at the table above is enough to reassure us that there’s no reason to worry about the collectability of trade receivables.
The only items overdue for more than 60 days are credit notes. Credit notes are adjustments issued by a seller to reduce the amount owed by a buyer. You could, if you reason far enough, say that Melexis is its own worst-paying customer. Let’s be honest—if your company’s “worst debtor” is technically yourself, that’s not a bad situation at all. In fact, it’s almost an ideal problem to have!
Inventory
Now, we turn our attention to inventory. To evaluate inventory effectively, we’ll conduct the following key checks:
Write-offs: We’ll assess whether Melexis has written off any obsolete or slow-moving inventory. High levels of write-offs can indicate inefficiencies in inventory management or declining product demand. In the mid-year report of 2024, we learn that as of 30/06/2024, Melexis wrote off approximately EUR 3.8 million of its inventory, which amounts to the "staggeringly high" percentage of 1.45%. To clarify, I’m just messing around—this is a completely normal percentage.
Additionally, around EUR 2.9 million of write-offs as of 31/12/2023 were reversed because this inventory turned out to be more valuable than originally thought. This means we can already consider the risk for this category significantly reduced. However, we’ll still perform one more test: the Inventory Turnover Ratio.
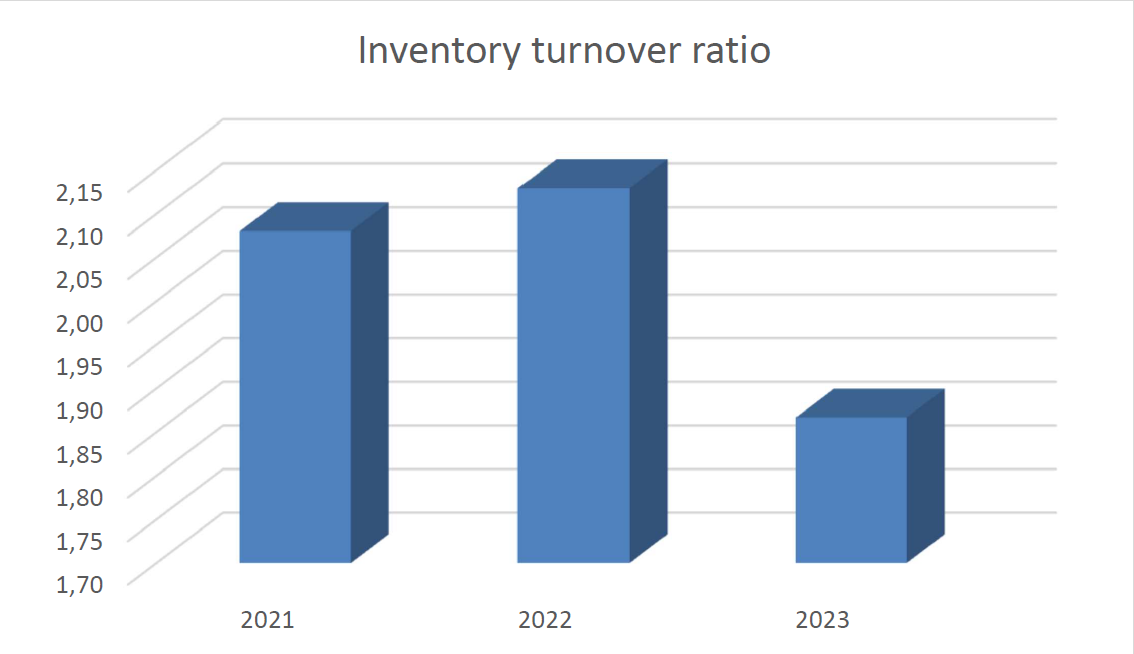
Inventory Turnover Ratio: This metric measures how efficiently the company is managing its inventory by analyzing how many times it’s sold and replaced during a specific period. The formula is:
Inventory Turnover Ratio = Cost of Goods Sold / Average Inventory
A higher ratio suggests better inventory efficiency, which is a positive indicator of operational performance. At Melexis, however, we observe that the Turnover Ratio is on the lower side, hovering around 2. This aligns closely with industry peers such as Infineon and Texas Instruments, where similar Turnover Ratios are the norm. Rather than being a company-specific risk, this reflects a characteristic of the semiconductor industry as a whole, and it is not something to worry about—especially when considering the limited write-offs on inventory.
However, this analysis does highlight that inventory poses a risk within Melexis and the broader semiconductor sector—something that didn’t surface in our qualitative review from Friday. Let this serve as a reminder that diving into the numbers is always crucial and should never be skipped! Cas, if you’re reading this, I’m sure this little detail just made your day.
Understanding these aspects of inventory management is crucial, as poor performance in this area can tie up capital and signal broader issues with production or sales forecasting.
Other Non-Current Assets: Securing the Supply Chain
Another noteworthy item within Melexis' assets is the category of Other Non-Current Assets. This includes prepayments, for approx. 192 million EUR tied to long-term agreements (LTAs), with X-FAB their key supplier. These agreements help Melexis secure critical volumes of wafers at more predictable prices, providing stability in its supply chain. In 2022 and 2023, Melexis faced challenges in meeting the demand for their products. Through these LTAs, the company aims to prevent such issues in the future by reserving goods with their suppliers.
That brings us to the end of our analysis of the assets; you might have noticed that we skipped PPE (Property, Plant, and Equipment). Although PPE is a significant part of Melexis' balance sheet, we’ll examine this in greater detail when analyzing the cash flows from investment activities in our next article. By linking it to capital expenditures, we’ll better understand how Melexis is reinvesting in its operational capabilities to sustain and grow its business and we will assess how efficient Melexis is in this task. Subscribe if you don’t want to miss out!
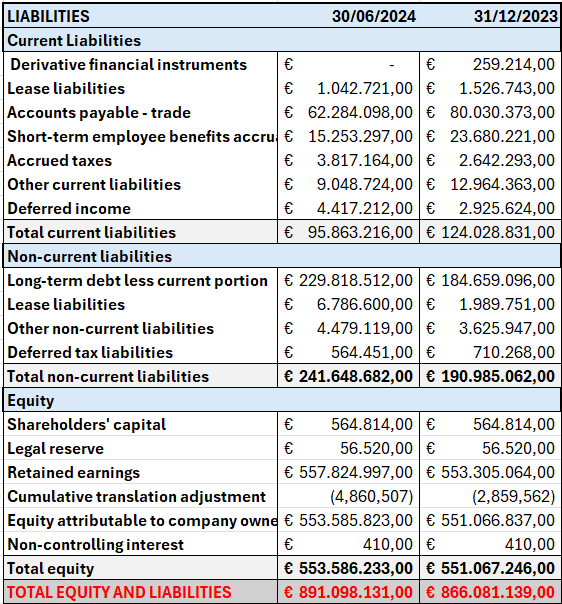
Turning to Liabilities
On the liabilities side of the balance sheet, three key areas stand out for analysis: trade payables, long-term debt, and retained earnings. While retained earnings won’t be discussed separately, it’s worth noting that they exceed all liabilities combined. This is a strong indicator of Melexis’ financial health, as it shows the company has built substantial equity through past profits.
Trade Payables
Now, we turn to trade payables. To assess this area, we’ll focus on days payable outstanding (DPO), a metric that measures how long it takes Melexis to pay its suppliers. The formula is:
DPO = (Trade Payables / Cost of Goods Sold) × Number of Days
A higher DPO can indicate efficient use of supplier credit, but excessively high values may suggest potential strains in supplier relationships. For Melexis, comparing the DPO to the previously calculated DSO gives insights into how the company balances its payments and collections. Ideally, a company collects from customers faster than it pays suppliers, creating a positive cash flow cycle.
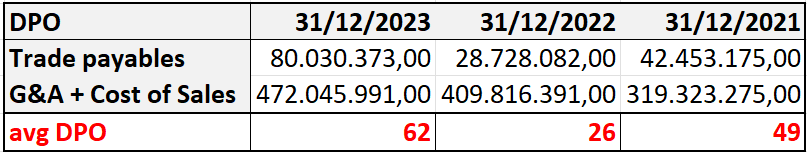
As you can see, trade payables show far more fluctuation than trade receivables. This clearly highlights that a balance sheet is just a snapshot in time. For example, Melexis might have received a large number of invoices at the end of 2023, which would explain the significantly higher DPO.
It would have been useful to have an ageing analysis for trade payables as well—something Melexis unfortunately doesn’t provide. This would have allowed us to determine whether the high trade payables mostly consisted of invoices from the final weeks of 2023. Who’s with me in proposing at the next shareholder meeting that they give us this data for 2024 and beyond?
Long-Term Debt: Conditions and Stability
Finally, we examine long-term debt. Debt providers maintain clear conditions for the debt they provide to Melexis, here are the conditions that Melexis has to satisfy in order to keep getting acces to credit:
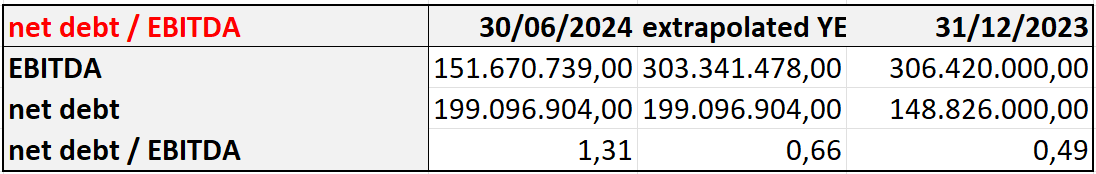
Net Debt/EBITDA ratio ≤ 3.5
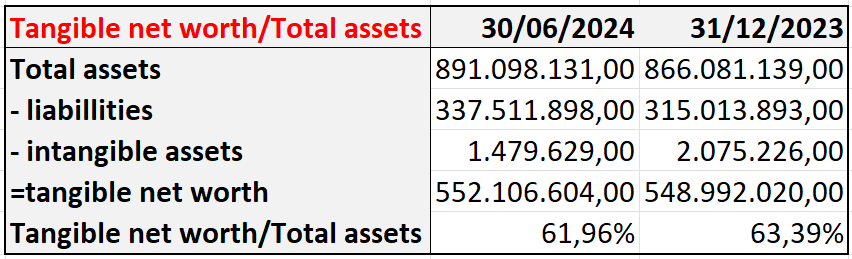
Tangible Net Worth/Total Assets ≥ 30%
These conditions ensure that Melexis remains financially disciplined while providing room to leverage its balance sheet for growth opportunities. By adhering to these covenants, the company signals financial stability and accountability to both investors and creditors.
Fortunately for me, Melexis provides the data needed to calculate these ratios in the glossary at the end of their report. This just goes to show—you really need to read the entire report when analyzing a company! It’s another example of doing as little heavy lifting as possible, a pattern we’re happy to embrace. Thanks to this, the ratios are quickly calculated. Before diving into the results, let me quickly share the formulas for Net Debt and Tangible Net Worth for clarification:
Net Debt Formula: Net Debt = Total Debt - Cash and Cash Equivalents
Tangible Net Worth Formula: Tangible Net Worth = Total Assets - Intangible Assets - Total Liabilities
A quick calculation shows that the Net Debt/EBITDA ratio is well below 3.5. In 2023, it was even under 0.5. If we extrapolate the results from 30/06/2024 to 31/12/2024, we see a slight increase, but nothing alarming. We’re safe here.
The Tangible Net Worth/Total Assets ratio tells a similar story. With a ratio of around 62%, there’s a significant buffer above the minimum requirement of 30%. We can conclude that there’s no immediate concern about covenant violations.
Solvency, Liquidity & Working Capital: Assessing Financial Health
We’re almost at the end of our analysis. Let’s be honest—it’s been quite the journey, not just for you readers but for me as well! But before wrapping up, it’s worth taking a closer look at Melexis’ Working Capital.
What is Working Capital? Working capital represents the difference between a company’s current assets and current liabilities. It’s calculated using the formula:
Working Capital = Current Assets - Current Liabilities
This metric is essential because it shows how much short-term capital the company has to cover its immediate obligations. Too much working capital could mean that the company isn’t using its resources efficiently, while too little could indicate potential liquidity issues. The key is finding a healthy balance.
As of 30/06/2024, Melexis’ working capital amounts to EUR 315.5 million, an increase of approximately EUR 30 million compared to 31/12/2023. These changes are crucial when analyzing the Cash Flows, which we’ll discuss in detail in the next article. For now, we can conclude that Melexis has a solid working capital buffer—a positive sign, especially considering that our analysis of trade receivables and inventory showed minimal inefficiencies. While the inventory turnover remains slow, this is a sector-specific trait, suggesting there is little room for efficiency improvements in this area.
To wrap up our financial analysis, let’s take a closer look at the solvency and liquidity ratios, which are crucial indicators of a company's financial strength and stability:
Solvency Ratios: These help determine whether Melexis has the resources to meet its long-term commitments. Two essential solvency ratios include:
Equity-to-Assets Ratio: This shows how much of the company’s assets are funded by shareholders’ equity. A higher percentage means Melexis depends less on borrowed money, indicating strong financial independence. It gives shareholders confidence that the company is not overleveraged. As of 30/06/2024, Melexis has an EV/Assets ratio of 62.12%. This is very healthy!
Debt-to-Assets Ratio: This measures the proportion of the company’s assets that are financed through debt. A lower ratio reflects less reliance on loans, making the company less vulnerable to economic downturns or interest rate increases. With a Debt/Assets ratio of 26.67%, we can conclude that Melexis doesn’t need to worry about the challenging economic situation currently affecting the sector.
Liquidity Ratios: These focus on Melexis’ ability to handle short-term financial obligations efficiently. Key liquidity ratios include:
Current Ratio: This compares the company’s current assets (like cash and receivables) to its current liabilities. A ratio above 1 is generally seen as healthy because it indicates the company can pay off its short-term debts comfortably. With a current ratio of 4.7, Melexis is exceptionally healthy. If they were to join us in running our marathon, Melexis would easily leave us in the dust with this level of fitness!
Quick Ratio: Similar to the current ratio but excluding inventory, the quick ratio offers a more precise view of liquidity. It answers the question: Can Melexis cover its immediate debts without relying on inventory sales? A strong quick ratio means the company is in good shape for handling short-term pressures. And here too, we see a high ratio of 2.02. In terms of financial health, Melexis is truly one of the top students in the class.
After the Health Check: The Results
After thoroughly examining the financial health of Melexis, it’s clear that the company is in excellent shape. Much like a person in the prime of their life, Melexis shows no signs of financial weakness. Its balance sheet reflects a robust and well-managed operation, capable of sustaining growth and withstanding challenges.
That said, even the healthiest individuals have a few minor concerns to monitor, and Melexis is no exception. The slower inventory turnover and fluctuations in trade payables are worth keeping an eye on—much like keeping tabs on a slightly elevated cholesterol level. These are not alarming issues but reminders that even strong companies benefit from vigilance.
Looking ahead, our analysis doesn’t end here. In the next article, we’ll dive deeper into the operational aspect of Melexis’ financials. Specifically, we’ll evaluate whether its cash flow generation is as strong as its financial health. Stay tuned for insights into the engine that powers Melexis’ remarkable performance.