


Melexis - Part V
The Grand Finale: Our Valuation

Stock Ticker: $MELE.BR
Current Price: €61,5 (on 20/01/2025)
Number of shares: 40.400.000
Market Capitalization: €2,48 Billion
Welcome back to the thrilling conclusion of our Melexis saga! Today is the grand finale: we’re putting a number on this valuation. But before we dive headfirst into the results, let me start with an important disclaimer (yes, I know—way to kill the buzz right away). We’ve worked hard to craft thoughtful estimates for Melexis’s key value drivers, but at the end of the day, these are still just that: estimates. They’re built on a foundation of assumptions that could turn out to be very wrong.
Curious about how we arrived at those assumptions? Don’t skip Parts I, II, III, and IV of this series, where we laid out Melexis’s story—exploring its qualitative aspects, potential future developments, and a deep dive into its financial history. These earlier pieces are essential for understanding the logic behind our assumptions and how we aim to keep them as realistic as possible.
Before deciding if Melexis is worth your investment, make sure to read those parts carefully. Then, dig into the annual reports, presentations, and other resources to conduct your own research. Armed with your own assumptions and estimates, you can tailor your valuation to fit your unique risk profile. For example, risk-averse investors might lean toward conservative estimates, while others may feel more adventurous.
Here’s how the rest of this article will flow: first, I’ll briefly walk you through our valuation process, so you’ll know exactly what we included—and what we left out. Next, we’ll share the assumptions Milan and I used in our respective valuations. As always, I’m the cautious one, while Milan takes a more optimistic view—so the truth likely lies somewhere in between (unless one of us can sway the other). Finally, the moment of truth: our valuation. While it might be tempting to skip to the end for the big reveal (after all, there’s no paywall to stop you), I urge you to stick with us and follow the story we’ve built to arrive at that final number. Let’s get started!
Valuation Method
Let’s break down the key value drivers behind Melexis’s valuation: revenue growth, EBIT margin, and reinvestment rate. Revenue growth and EBIT margin positively influence cash flows—the higher they are, the greater the cash available to investors. Reinvestment rate, however, has a dual impact: directly, it reduces short-term cash flows by allocating funds for growth; indirectly, it supports future revenue growth. Investing, as always, is a balancing act.
We estimate these drivers across three periods: year one (2024), the medium term (2025–2028), and the longer term (2029–2033). Beyond that, we assume the company enters a “going-concern” phase, continuing indefinitely - read this article if you’re wondering why. These projections rely on educated guesses, as no one can perfectly predict financial metrics over such a long horizon. That uncertainty brings us to the key question: How does Melexis’s value change if we’re wrong?
To address this, we conduct a sensitivity analysis. Instead of relying on a single “base case,” we also model optimistic (bull) and pessimistic (bear) scenarios to test how variations in the value drivers affect the outcome. Realistically, scenarios often mix: for example, revenue growth might follow the bull case, while reinvestment aligns closer to the bear case. To capture this complexity, we introduce a simulation that generates thousands of random combinations of value drivers, weighted toward the base case but allowing for extremes. This approach gives us a range of potential outcomes, not just a single number, helping us understand both the risks and opportunities.
A key part of our analysis involves estimating the Internal Rate of Return (IRR), which serves as the discount rate. The discount rate reflects the return investors require for taking on the risk of an investment. Rather than predefining this rate, we calculate the IRR that aligns Melexis’s estimated future cash flows with its current market price. This represents the annual return an investor might expect, assuming our value driver assumptions hold true.
Optimistic assumptions lead to higher estimated cash flows and a higher IRR, reflecting greater potential returns. Conversely, more conservative assumptions result in a lower IRR. Using our simulation approach, we calculate IRRs across thousands of scenarios, allowing us to analyze a range of possible outcomes, not just a single estimate.
This method provides clarity on potential returns, offering insights into the most likely outcomes as well as the best- and worst-case scenarios. It ultimately helps answer the critical question: What return can I realistically expect from investing in Melexis under varying conditions?
Assumptions
Building on the strategic insights and final assumptions, Melexis is well-positioned to navigate an evolving market landscape with a focused approach. The company’s revenue trajectory is expected to start with a forecasted dip of -2.52% in FY 2024, recovering to a robust 15% growth during Y2-5, before normalizing to a steady 10% in Y6-10. Over the long term, growth is expected to moderate further, aligning with a conservative 5% rate as the company matures. While early volatility in revenue growth remains a risk, variability is anticipated to stabilize within a range of +/- 5%, underscoring Melexis' ability to manage competitive pressures and operational uncertainties.
In terms of profitability, EBIT margins will initially reflect market pressures, dipping from 26.27% in FY 2024 to 25% during Y2-5. However, they are set to rebound to 27% in Y6-10, reaching 27.5% in the long-term going concern scenario. This improvement aligns with Melexis’ focus on operational efficiency and steady convergence toward industry benchmarks.
Melexis’ reinvestment rate, a critical driver of sustained innovation and growth, starts strong at 40.73% in FY 2024, tapering to 35% in Y2-5 and 30% in Y6-10. This reflects a shift in strategy from aggressive growth investments to a balanced approach in line with a maturing business. Even with a reinvestment range uncertainty of +/- 15%, Melexis’ fabless model ensures that capital allocation remains efficient and targeted.
Overall, Melexis is cruising down the road of innovation-driven growth, balancing bumps and curves with ease! With its eyes on electrification, premiumization, and advanced driver-assistance systems, the company is geared up to tackle the future head-on. The journey might have a few detours—like the early revenue dip or a little market turbulence—but Melexis’ fabless model and focus on efficiency make it a smooth operator. Steady EBIT growth and smart reinvestments mean it’s not just staying in the race; it’s leading the pack, ensuring it remains a key player in the ever-evolving tech landscape.
Fair Price
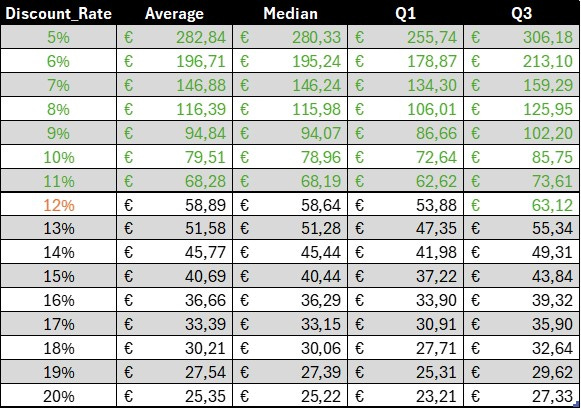
The final valuation for Melexis highlights its potential value under varying discount rates, showcasing a solid range of outcomes. At a 10% discount rate, the average valuation lands at €79.51, with a median of €79.25, and a bear-bull range of €72.64 to €85.75. This indicates a central valuation consistent with investor expectations.
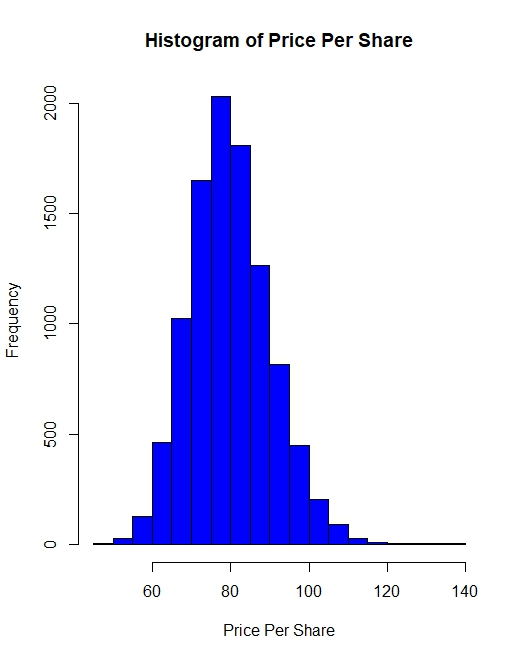
When considering the broader range of discount rates from 5% to 20%, the valuations fluctuate from €282.84 at the low end to €25.35 at the high end, reflecting sensitivity to the discount rate applied. The median valuation across all rates stabilizes near €79.25, emphasizing a reliable core value.
In terms of expected IRR, the median stands at 11.90%, and ranges from a conservative bear case of 10.63% to a more optimistic bull case of 13.47%. The extreme bear case reflects an IRR of 9.05%, highlighting a cautious scenario, while the extreme bull case rises to 24.56%, showcasing the potential for exceptional performance under optimal conditions. These figures underline Melexis’ ability to deliver strong returns, making it an attractive proposition for investors looking to align with its growth trajectory and innovation-driven focus.
Final Remarks
Melexis demonstrates a balanced position in its valuation, with a fair price centered around €79.25 per share, based on a range of scenarios reflecting diverse market conditions. The analysis highlights a range of €72.64 to €85.75 at a 10% discount rate, alongside an expected IRR median of 11.90%. The scenarios extend from a more cautious bear case IRR of 9.05% to an optimistic bull case of 24.56%, showcasing the company’s ability to navigate potential challenges and opportunities.
These projections reflect Melexis’ focus on innovation in areas like electrification, premiumization, and advanced driver-assistance systems, supported by steady reinvestment and operational efficiency. While the valuation outcomes depend on key assumptions, the analysis provides a framework for understanding Melexis’ potential in a dynamic market environment.
With this analysis wrapped up, we’re closing the chapter on Melexis. On Friday, we’ll return with a completely different topic—so stay tuned for a fresh perspective!
A truly impressive bit of work on this ... and I say that with all due admiration. Be well ... hope this year is rewarding, productive and delivers a nice payoff (in both the tangible and intangible sense of the word).
Hope we cross paths regularly.
Respectfully;
Bill P.