


Should You Sell Your Smartphoto Shares?
The Answer May Surprise You

Today, we’re not going to talk about Aris – our latest hidden gem, which we found through a top-down analysis. Instead, we’re diving deep into a company that’s close to our hearts (and not just because our portfolio sits in our breast pocket).
This Tuesday, news broke that the major shareholders of Smartphoto made a takeover bid for the remaining public shares. Why? Because they had just bought out two other major shareholders, pushing their total stake above 30%—which legally required them to make a public offer.
Now, you might be thinking: Okay, interesting… but why should I care? Simple: we’re Smartphoto shareholders. Our OG readers will remember—this was actually the first analysis we ever published. And honestly? We’ve learned a lot since then about making research engaging. So if you dig up that old analysis…
Read at your own risk!
Now, let’s talk numbers. The offer came in at €28.50 per share, a 46% premium over the stock’s then-current price. Sounds generous, right? And yet… we weren’t exactly thrilled. We started buying in at around €27 because we already saw the stock as undervalued back then. So, this offer feels a bit too opportunistic—one we might want to reject.
That’s why today, we’re putting this bid under the microscope. We’re going to conduct a Reverse DCF analysis—but not just any Reverse DCF. More on that in a moment. First, let’s break down what a Reverse DCF actually is.
Why A Reverse DCF?
“Invert, always invert.”
Charlie Munger
We’re not diving into a Reverse DCF just because Munger once said something along those lines. No, we’re doing it because this method provides a powerful insight into the expectations embedded in the current offer price. By applying a Reverse DCF, we can calculate the required growth in Free Cash Flow to Firm (FCFF) that Smartphoto would need to achieve to make this offer price a reasonable long-term investment. In short, it helps us determine whether the bid is realistic and if the underlying growth assumptions are justified.
This approach is often favored by investors as an alternative to a traditional DCF. Why? Because unlike a standard DCF, where you guess future growth rates, a Reverse DCF works backward—you take the current market price, assume a required return, and then figure out what kind of growth expectations are baked into that price. This makes it easier to assess whether the market’s expectations are reasonable, overly optimistic, or way too conservative.
By running a Reverse DCF, we can uncover the implied growth rate in FCFF at the €28.50 offer price.
The implied growth rate is essentially the rate of growth embedded in the current share price (or in this case, the bid price). In other words, it represents the growth expectations assumed by investors based on the current price and a specific required return (discount rate).
A Reverse DCF allows us to calculate this implied growth rate by determining how much FCFF growth is needed to make the sum of discounted cash flows equal to the company’s market value.
Breaking Down the Calculation
Here’s a quick step-by-step guide to calculating the implied growth rate (g):
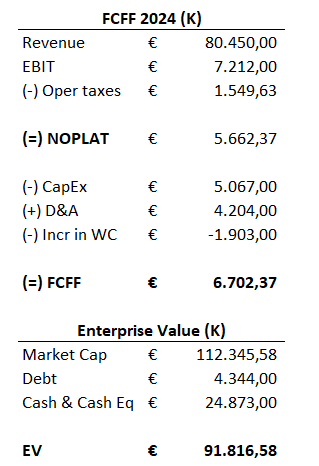
Define the input variables:
Current share price & shares outstanding → Market Cap
We have adjusted the market capitalization to reflect the market cap at a share price of €28.50 per share, which corresponds to the offer price.
Minus debt + Cash & Cash Equivalents → Enterprise Value (EV)
Latest known FCFF (Free Cash Flow to Firm)
Required return (discount rate)
Set up the DCF formula without a pre-defined growth rate:
In a standard DCF, FCFF is projected using an assumed growth rate (g).
In a Reverse DCF, we solve for g instead of assuming it.
Solve for g:
The implied growth rate g is found using the following formula:

where:
V = Enterprise Value
C₀ = FCFF in year 0
r = required return / WACC

Interpreting the Results
If g is extremely high (e.g., 15–20% per year), the market may be too optimistic about Smartphoto’s future.
If g is low or even negative, the market might be too pessimistic about the company’s potential.
We’ll test different required returns ranging from 5% to 20%, allowing us to analyze the expected returns at different FCFF growth rates. This sensitivity analysis helps us better understand how Smartphoto’s expected growth translates into potential returns for investors like us.
Now that we’ve covered the theory (hopefully without putting you to sleep), it’s finally time to apply the Reverse DCF to Smartphoto! 🚀
Dirt Cheap or Hella Expensive?
The first step is to determine the input variables. Conveniently, Smartphoto has just published its full-year financial results for FY 2024 this week. I wouldn’t be surprised if the major shareholders got a sneak peek at these numbers before making their bid.
I’ll spare you the nitty-gritty details, but after a deep dive into the numbers, we’ve arrived at the following key variables:
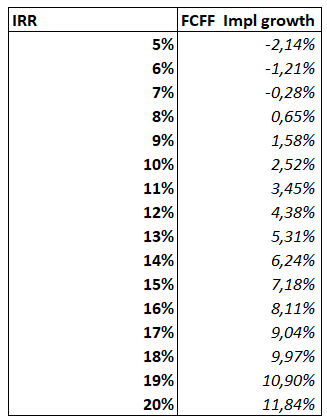
Now that we have these variables, it’s time to combine them with our required returns. As we mentioned earlier, we’ll be calculating the implied growth rate 15 times, varying the required return (r) from 5% to 20%.
After applying the formula, we arrived at the following results:
I don’t think I need to draw a picture to make this point, but for those who still have doubts, let me clarify.
If you’re aiming for an average market return of 7–8%, then at the €28.50 offer price, the implied FCFF growth rate falls between -0.28% and +0.65%.
That’s an incredibly low growth expectation—and it really is as small as it sounds.
To put this into perspective, let’s take a look at the historical evolution of Smartphoto’s FCFF over the past few years in the graph below:

Given that Smartphoto’s lower FCFF this year is due to substantial CapEx investments—almost double that of 2023—rather than operational issues, it seems reasonable to expect FCFF to increase rather than decline in the future. In fact, these heavy 2024 investments signal that management clearly sees growth opportunities ahead.
Moreover, Smartphoto’s track record over the past few years proves their ability to sustain solid growth. Between 2018 and 2024, revenue grew at an impressive CAGR of 17%, while EBIT surged with a CAGR of 30%. That’s a strong indication that the company knows how to scale efficiently and drive profitability.
Closing Remarks
We’re always cautious when it comes to giving direct buy or sell advice. We don’t see ourselves as analysts handing out price targets—instead, we’re independent researchers who share their findings with anyone interested. That means we aim to be as objective as possible, keeping our biases in check while presenting a clear picture of reality.
But this time? This is different.
There’s already a bid of €28.50, and the market price has naturally risen to that level. In our view, buying or selling at this stage doesn’t make much sense. And for once, that gives us the freedom to share our unfiltered opinion on this bid.
We don’t like it one bit.
Sometimes, things really are that simple. Now, let’s be fair—I don’t blame the people behind this bid. They’re taking advantage of the stock’s recent slump, and compared to the €19 per share price before the offer, you could argue that it’s still a reasonable deal.
But for those who truly know this company and have the patience to play the long game, it’s clear: this offer should be rejected.
Coincidentally, Sam Hollanders from the newsletter “Valuing Dutchman”—whose fund is one of the largest shareholders in Smartphoto—shared his perspective on the situation. Here’s what he had to say:
“I want to see if I can find large blocks of shares (+3,000 per block) to apply pressure. If that doesn’t work, I fear we won’t be able to squeeze much more out of this. Even if I believe the offer is too low, the choice is then between waiting it out or reallocating to another undervalued stock. Given how the market is moving right now, the latter might be the better option.”
We share his concerns. There’s a real chance that a majority of shareholders will accept this bid simply because of the significant premium over the previous market price. Unfortunately, we can’t predict how this will play out just yet.
But one thing is certain: we’ll keep you updated.
In the meantime, we’re diving deeper into Aris, and you can expect Part II in your inbox this Sunday! Stay tuned. 🚀
📢 What about you? What do you think about this offer? Share your thoughts in the comments—I’d love to hear your take! 👇
🔔 Don’t forget—our deep dive into Aris Water Solutions continues this Sunday. Subscribe now so you don’t miss the next analysis!
Please note: This article includes a disclaimer regarding investment advice.
Our Recent Posts

Why Aris Might Be the Oil Industry’s Best-Kept Secret

This March, we're diving deep into Aris Water Solutions, a company that made it onto our radar through a top-down analysis.
When Is Value Valuable? A Case Study

Finance is full of buzzwords and acronyms, but few concepts are as crucial—and as misunderstood—as the Weighted Average Cost of Capital (WACC). At its core, WACC is a blended estimate of the cost of equity and the cost of debt, rolled into a single number: the cost of capital.
Great post!
Good quant work! Looking forward to Aris