


The Last Cut
Top-Down Analysis Part IV

This Is It. The Final Step in Our Top-Down Analysis
We've made it. After weeks of research, debates, and ruthless eliminations, we have arrived at the final step: identifying the one company within the Environmental & Waste Services sector that deserves our deep dive. Today, we take everything we've learned and apply it to pinpoint the best investment opportunity in this underappreciated industry.
The Journey So Far
In Part I, we identified three key megatrends reshaping the world: Digitalization, Aging Demographics, and Sustainability. These were our guiding stars, leading us toward sectors that hold strong long-term potential.
In Part II, we took a quantitative approach, analyzing profitability, growth, and valuation metrics across multiple sectors. After rigorous eliminations, three finalists emerged:
Semiconductor Equipment (Digitalization)
Environmental & Waste Services (Sustainability)
Healthcare Support Services (Aging Demographics)
From there, we embarked on Part III, conducting qualitative deep dives into each sector to evaluate their real-world investment potential. This led us to a dramatic final showdown between Environmental & Waste Services and Healthcare Support Services.
Also don’t miss out on our extra part of this series!
Both sectors showed strong potential. Healthcare Support Services benefits from aging demographics and AI-driven advancements but faces regulatory risks and complexity. Environmental & Waste Services, however, offers stability, technological growth, and lower disruption risks—making it our final winner.
Sifting Through the Trash
The Data That Made It Possible
Before diving into our methodology, we must first pay our respects to the godfather of valuation, Aswath Damodaran. His exhaustive datasets on sectoral and regional valuation metrics were the backbone of our analysis.
For company-specific data, we turned to the Refinitiv database, a treasure trove of financial insights. We’d also like to extend our thanks to our (former) university for never updating their login credentials, allowing us to continue benefiting from their premium research tools long after graduation. An oversight on their part, a golden opportunity for us.
Step 0: Defining the Universe of Companies
Our journey began with all companies that Damodaran grouped under the Environmental & Waste Services sector. This gave us a broad starting point, ensuring we didn’t overlook potential gems.
Step I: Filtering by Regulatory Environment
The first major filter we applied was regulatory stability by region. As discussed in Part IV, one of the biggest challenges in this sector is navigating bureaucratic inefficiencies and unpredictable enforcement. Any region with excessive red tape, inconsistent enforcement, or political instability was removed from our selection pool. This allowed us to focus only on regions where businesses could operate efficiently and predictably.
Step II: Regional Comparison & Final Selection
Once we narrowed down the regulatory landscape, we compared the remaining regions against each other to determine the most favorable economic and business environment. This step ensured we weren’t just looking at individual companies in isolation but also considering the broader macroeconomic and structural factors that could influence long-term success.
Step III: Quantitative Screening with Refinitiv
With a single region selected, we turned to Refinitiv’s stock screener to quantitatively compare the remaining companies. Using key financial metrics such as revenue growth, return on capital, debt levels, and valuation multiples, we stacked each company against its peers. This final stage allowed us to identify the one company that stood out as the best investment opportunity in this sector.
Step I: Filtering Out Regulatory Nightmares
Our first step was eliminating regions where excessive, complex, or unpredictable regulations create unnecessary risks.
In the waste management and environmental services sector, regulatory stability is paramount. Businesses must comply with strict rules on waste disposal, emissions control, and resource recovery, making a clear legal framework essential.
Frequent policy changes, inconsistent enforcement, or unclear guidelines can lead to unexpected costs, operational disruptions, or even forced shutdowns. When governments shift regulations without transition periods, companies are left scrambling to adapt, increasing financial and operational risks.
The EU: A Bureaucratic Labyrinth
The European Union has extensive and stringent environmental regulations that enforce high compliance standards. While these policies promote sustainability, they also result in significant compliance costs and complex permitting processes. Worse, these regulations are frequently updated, adding another layer of uncertainty. Combined with Europe’s infamous bureaucratic red tape, this made the EU an easy region to eliminate from consideration.
China: A Moving Target
China has aggressively tightened its environmental laws and ramped up enforcement. However, these regulations often change rapidly and unpredictably, making long-term planning difficult for companies. The risk of sudden policy shifts, coupled with high operational compliance costs, made China a less-than-ideal investment landscape.
Southeast Asia: Instability and External Dependence
The risks in Southeast Asia are multi-faceted:
Unstable legislation: Many countries frequently revise their environmental laws without transition periods, leaving investors in limbo.
Dependency on foreign waste: Nations like Malaysia and Indonesia relied heavily on processing Western waste imports, but since China’s import restrictions, the recycling market has become volatile.
South America & Africa: Political and Economic Risks
While these regions hold long-term potential, they currently present too many challenges, including:
Political instability and corruption
Volatile inflation
The Finalists: USA & Canada vs. Australia and New Zealand
After eliminating high-risk regions, two options remained: North America (USA & Canada) and Australia & New Zealand.
USA : While the U.S. has had its fair share of political turbulence—especially under Trump, who is no champion of sustainability—individual states have considerable autonomy in setting their environmental policies. Many states have robust environmental agencies and enforce their own regulations, a trend that Trump reinforced during his first term by granting more policymaking power to the states.
Australia, Canada & New Zealand: This region is known for stable, well-enforced environmental regulations. For example, Australia’s Waste Management & Resource Recovery Association plays a key role in setting industry standards and ensuring compliance with waste regulations, providing investors with a predictable legal landscape.
With these two regions left standing, our next step was determining which one offers the best investment opportunities.
Step II Looking For the Best Region
Now that we have narrowed down our selection to USA & Canada and Australia & New Zealand, we need a data-driven approach to determine which region presents the best investment opportunities in the waste management sector.
We will evaluate these regions using multiples, which allow us to compare how the sector is valued in each region. Since waste management is a capital-intensive and anti-cyclical industry, the following multiples are particularly relevant:
P/E (Price-to-Earnings Ratio) – Measures how much investors are willing to pay for each dollar of earnings. A lower P/E can indicate an undervalued sector, but only if earnings are stable and sustainable. Since waste management is an anti-cyclical industry—remaining essential regardless of economic downturns—evaluating earnings consistency is key to ensuring long-term investment viability.
PEG (Price/Earnings-to-Growth Ratio) – Adjusts the P/E ratio for growth expectations. This is crucial since we don’t just want a cheap sector; we want one with solid growth potential as well.
P/BV (Price-to-Book Value Ratio) – Compares market value to the book value of assets. In capital-intensive industries like waste management, this ratio helps assess whether assets are fairly valued.
EV/EBITDA (Enterprise Value to Earnings Before Interest, Taxes, Depreciation, and Amortization) – A strong measure for capital-heavy industries, as it accounts for debt and cash flows, providing a clearer picture of actual operational performance.
These multiples will help us gauge which region offers the best balance of valuation and growth potential. In the next step, we will apply these metrics and analyze the results to determine the most attractive investment landscape for our final selection.
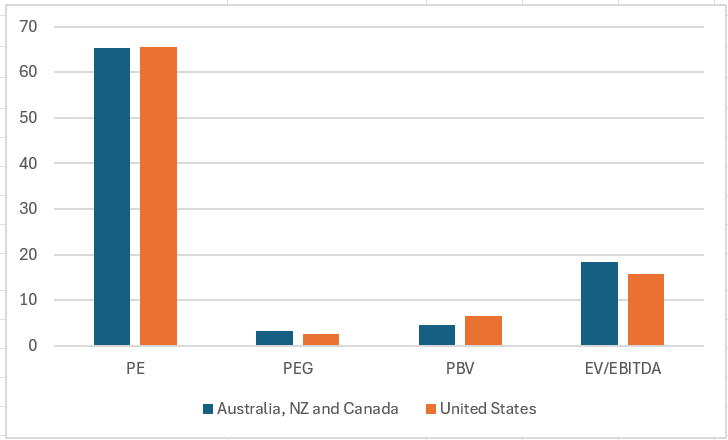
The multiples analysis reveals that both regions are priced similarly, with high P/E ratios and PEG ratios above 1, indicating a general overvaluation across the board. However, when comparing P/BV and EV/EBITDA, we find:
Canada, Australia & New Zealand show a more attractive P/BV ratio, suggesting that assets in these markets are more reasonably valued.
USA has a better EV/EBITDA, indicating stronger cash flow generation relative to enterprise value.
With both regions showing trade-offs in valuation metrics, we need to go beyond multiples to make a final decision.
Enter operational performance indicators.
A look at the margin comparisons, however, provides a much clearer distinction between the two regions.
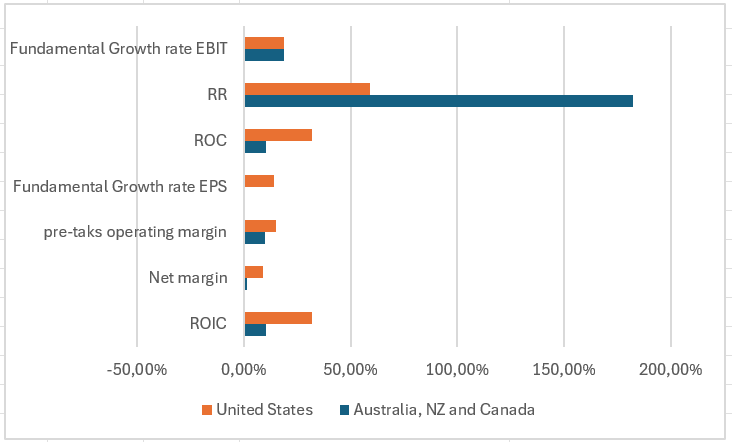
The margins, ROIC, ROC, and EPS growth clearly indicate that the USA generally demonstrates superior operational performance, offering a broader pool of investment opportunities.
Besides that, Australia, New Zealand, and Canada can only keep up in EBIT growth due to significantly higher Reinvestment Rates (RR), which can be a negative factor as it suggests companies need to reinvest more capital to sustain growth rather than efficiently generating returns. This higher RR can lead to lower free cash flow and higher dependency on external funding. With these factors in mind, the USA emerges as the decisive winner for our regional selection.
Step III: The Final Selection – The Companies Themselves
After an exhaustive selection process that would make even the most rigorous analysts proud, we have finally arrived at the companies themselves. With only the best of the best remaining, our search inevitably leads us to one dominant playing field: the American market. Time and time again, the U.S. proves to be a breeding ground for world-class companies with scale, efficiency, and growth potential.
Now, the final task remains: identifying the one company that stands above the rest.
We started with 391 companies, applying strict filters along the way. After eliminating firms that failed to meet our criteria, only 26 remained. The next step was filtering out unprofitable companies, reducing the pool even further to just 8 finalists.
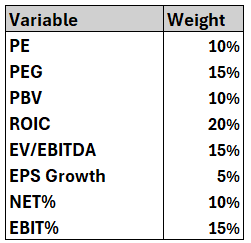
These 8 companies were then subjected to a rigorous ranking system based on multiple weighted variables. The factors we deemed most important received the highest weight, while less critical ones carried lower scores. Each company was ranked from best to worst per variable (1 = best; 8 = worst). The rankings (1 - 8) were then multiplied with their respective weights. At the end of this process, the company with the lowest total score emerged as the winner—our final investment selection.
And the winner is.....

Aris Water Solutions takes the crown!
As the name suggests, this is a player in the water and waste management sector. But we won't reveal too much just yet—that's for next week!
But I can tell you the following. This company secured the top spot by ranking first in at least four key variables: PEG, EPS growth, EV/EBITDA, and EBIT%. So we think we picked the best one.
Closing Remarks
And just like that, we’ve reached the finish line of our top-down analysis marathon. What started as a sweeping look at global megatrends turned into a relentless filtering process, slicing through sectors, regions, and companies until we landed on Aris Water Solutions—the last stock standing.
Now, let’s not kid ourselves—this isn’t a magic formula. A structured top-down approach helps spot strong contenders, filter out the noise, and tilt the odds in our favor, but it’s no crystal ball. There are probably better stocks out there, hiding in overlooked corners of the market. But that’s not the point. The goal was to cut through the hype, dodge the landmines, and land on an investment idea that isn’t already on every index fund’s shopping list—and that’s exactly what we did.
But now comes the real test—figuring out whether Aris Water Solutions is actually worth a dime. Next Sunday, we dive into the numbers—scrutinizing its financials, growth potential, and whether it truly stands out in the market or falls short.
📢 What do you think? Is Aris Water Solutions the real deal? Drop your thoughts in the comments! Let’s discuss. 👇
🔔 Don’t miss out! This Friday, we’ll reveal our book of the month!
Please note: This article includes a disclaimer regarding investment advice.
Our Recent Posts
Why Smart Contracts Aren’t as Smart as You Would Think.

It’s Sunday night—not just any Sunday night, but Super Bowl night. You and your friends are gathered for a “fun” (read: competitive) evening of NFL action. One of your buddies, a die-hard Chiefs fan, smirks and says, “Let’s make this interesting. I bet the Chiefs get their three-peat tonight.”
And The Winner Is...

Ladies and gentlemen, welcome to the final showdown. After weeks of research, discussions, and some serious back-and-forths, we’ve narrowed our focus to two sectors that have caught our attention: Environmental & Waste Services and Healthcare Support Services
Why Saving Never Goes as Planned. And What I Try To Do About It.

The other day, I found myself knee-deep in my budgeting Excel sheet—yes, I’m one of those people. At the start of the year, I had meticulously mapped out my financial game plan, estimating all the usual suspects: income, expenses, and (in an ideal world) savings. You know, that magical leftover category where money is supposed to sit patiently, waiting …
Curious about your guys opinion on the stock, there seems to be a lot of debt involved. Good series!
"Thanks for the compliment! 🙌 We’ll definitely dive into this debt situation. Our first part on Aris will drop next Sunday (not this week's Sunday).