

The Quantitative Reality Check
Top-Down Analysis Part II

February is here, and what better way to kick off the month than with a new part of our top-down analysis? We’re in the midst of a full-fledged breakdown of the process, step by step. If you’re new to this series and unfamiliar with what a top-down analysis entails, we highly recommend checking out the previous parts first.
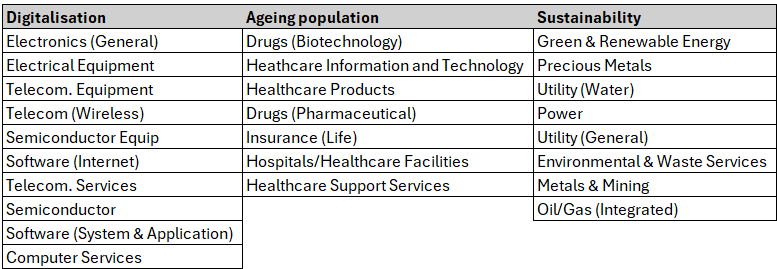
In Part I of our top-down analysis, we identified three major global trends: digitalization, aging demographics, and sustainability. We explored how these forces are reshaping industries and pinpointed the sectors that stand to benefit the most. Additionally, we took a reality check in our extra part of this Friday, highlighting the risks of blindly following trends, using the DeepSeek debacle as a cautionary tale.
This past Friday served as a stark reminder that investing in these trends is not without risks. No matter how promising the future may seem, not every investment tied to these megatrends leads to success. The allure of technological breakthroughs, demographic shifts, and sustainability initiatives can paint an enticing picture, but as we’ve seen, even the most hyped opportunities can falter.
That’s why in Part II, we’re putting the glossy narratives to the test. Are these trends truly shaping the next wave of profitable industries, or is much of it just well-crafted storytelling? It’s time to cut through the noise and analyze the numbers to see which sectors actually hold up under scrutiny.
The goal? To determine which single sector per trend presents the strongest investment case. These chosen sectors will then be subject to a deep qualitative dive in Part III.
Wall Street’s Got Talent
Investing, much like a talent show, is about finding true performers—the sectors that don’t just talk the talk but can actually walk the walk. We’ve gathered our contestants, 25 sectors that claim to be the next big thing, each tied to one of our three megatrends: digitalization, aging demographics, and sustainability.
But claims alone don’t cut it. Just like in any competition, we’ll put them through a series of tests to separate raw potential from empty promises.
To ensure this evaluation is backed by solid data, we’ve turned to one of the best in the field—Professor Aswath Damodaran. A legend in the world of corporate finance and valuation. His comprehensive datasets, available on his website, provide invaluable insights into sector valuations, profitability, and risk factors. If there’s one person you want in your corner when analyzing industries or companies, it’s him.
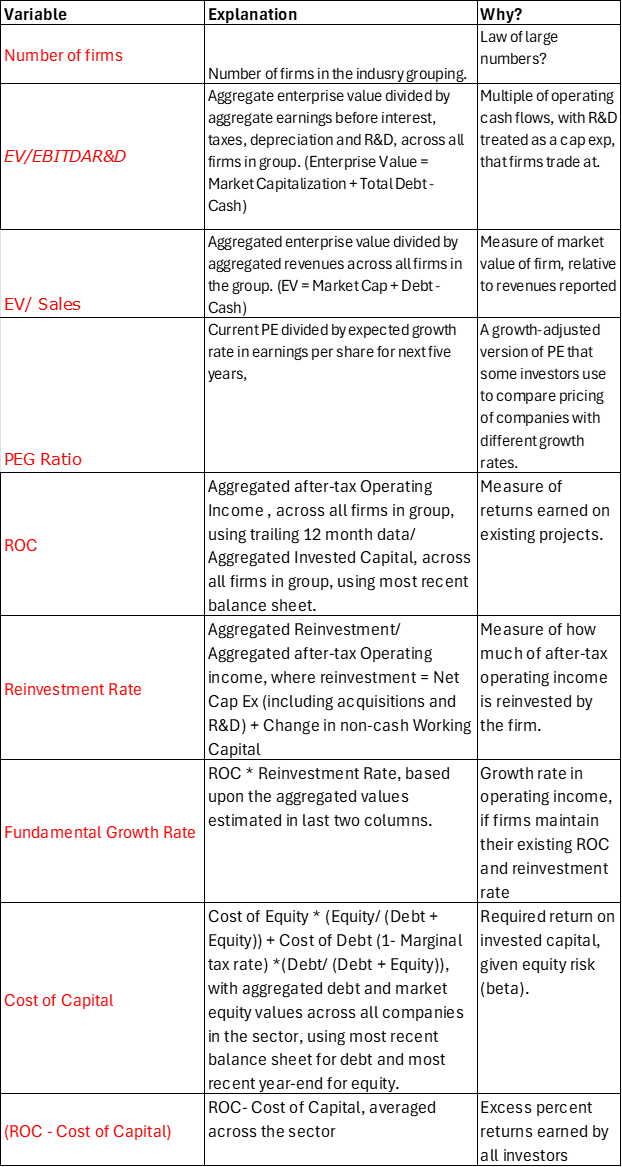
For those eager to explore the numbers themselves, we’ll be providing a link where you can access the raw data. Additionally, we’re preparing an overview containing all the formulas and definitions for the key metrics and multiples used in this analysis—making it easier for you to apply these insights to your own research. You can find both at the end of this post!
Not Making It Past the Auditions
“Everybody’s got a different circle of competence. The important thing is not how big the circle is. The important thing is staying inside the circle.”
Warren Buffet
Just like in any talent competition, some contestants walk onto the stage only for the judges to immediately realize—they signed up for the wrong show. While these sectors might be stars in their own right, they fall outside our expertise. So, before we even get to the real selection process, let’s say goodbye to a few ambitious hopefuls who simply don’t belong on this stage:
Drugs (Biotechnology & Pharmaceutical) – Whether it’s cutting-edge biotech or traditional pharma, this sector demands deep scientific knowledge, regulatory expertise, and a strong grasp of R&D pipelines. Without that, investing here is more gambling than strategy. We do like to gamble but we leave that for the casino.
Metals & Precious Metals – From industrial mining to gold and silver speculation, these sectors require deep expertise in extraction technologies, geological assessments, and environmental regulations. Understanding the complex processes of resource discovery, refinement, and logistical challenges is essential. Without that knowledge, evaluating their true investment potential becomes guesswork.
Insurance (Life) – Life insurance is a complex beast, relying on actuarial science, long-term risk modeling, and ever-shifting regulatory landscapes. Pricing policies, forecasting liabilities, and managing reserves require deep industry insight. Without a strong grasp of these intricacies, even the most promising investment can quickly unravel.
Round 1: Show Us the Value!
Now that we’ve filtered out the sectors that don’t belong on this stage, it’s time for the first real test. In this round, our contestants will have to prove they can actually generate returns that justify their place in the competition.
The primary metric we’ll use here is Return on Capital (ROC). While many investors look at Return on Invested Capital (ROIC), ROC provides a better basis for comparison across different sectors. ROIC adjusts for capital structure, making it useful for company-level analysis, but since we’re comparing entire industries, ROC allows for a more standardized view of how efficiently sectors generate profits from their capital.
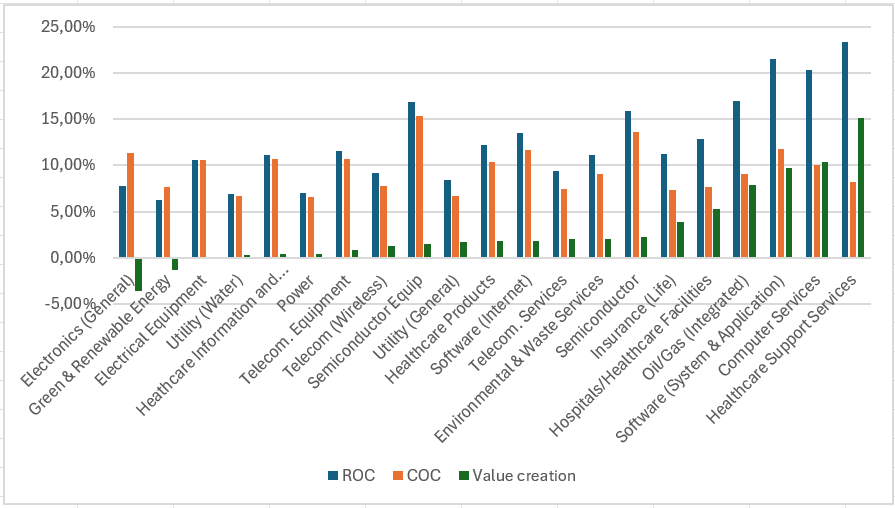
Of course, generating returns is one thing—but are these returns actually creating value? To ensure that we only move forward with sectors where value creation is the norm, we’ve visualized the relationship between ROC and Cost of Capital (COC) in the graph below. The sectors are ranked from worst to best—those on the left are struggling, while those on the right are delivering strong results.
But we didn’t just eliminate sectors where ROC is lower than COC. We also cut industries where the margin between ROC and COC is smaller than 1%, as this slim difference suggests weak value creation and a lack of a meaningful competitive edge. Only the sectors that show a clear ability to generate excess returns have made it through. All sectors positioned to the left of Telecom Equipment, including Telecom Equipment itself, will not be moving forward.
Round 2: No Growth, No Glory
The first round eliminated the sectors that couldn’t consistently generate returns above their cost of capital. But creating value isn’t just about high returns—it’s also about sustaining and scaling those returns over time. That’s what separates a fleeting success from a true long-term winner.
In this round, we’re testing whether the remaining sectors can pair strong returns on capital with solid growth. Why? Because the ultimate driver of shareholder value isn’t just profitability—it’s the ability to reinvest those profits into expanding operations, capturing more market share, and compounding value over time.
A sector with high returns but no growth eventually stagnates, limiting upside potential. On the other hand, a sector with strong growth but weak returns risks destroying value if it expands inefficiently. The sweet spot? Industries that generate both high returns and sustainable growth, ensuring that value creation isn’t just a one-time event but an ongoing process.
To properly assess growth potential, we need more than just ROC—we need to evaluate a sector’s Reinvestment Rate. The reinvestment rate measures how much of a company’s earnings are being plowed back into the business to fuel future expansion.
Why is this important? Because growth doesn’t just happen—it requires capital.
Now, let’s put our remaining contestants to the test—who can turn profitability into long-term expansion, and who’s just running in place?
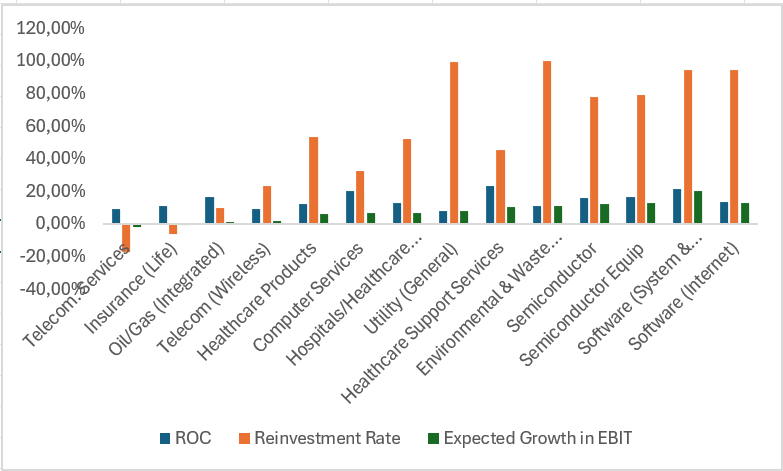
As seen in Graph II, we have applied the same methodology as in Graph I, ranking sectors from low to high. However, for this round, we have raised the bar significantly when it comes to the expected growth.
As a benchmark, we have decided that sectors unable to grow their EBIT by at least 10% will be eliminated. Why? Well, given the number of strong contenders left in our talent competition and how far we have progressed, it is only fair to set higher expectations at this stage.
Following this cut, we are left with five sectors that have proven their ability to pair strong returns with sustainable growth:
Healthcare Support Services
Environmental & Waste Services
Semiconductors
Semiconductor Equipment
Software (System & Application)
Software (Internet)
For the megatrends of aging demographics and sustainability, we have already found our winners: Healthcare Support Services takes the lead for aging demographics, while Environmental & Waste Services stands out as the best sector for sustainability.
However, when it comes to digitalization, we still have four strong contenders. With Semiconductors, Semiconductor Equipment, System & Application Software, and Internet Software all proving their worth, we need an additional round to determine which sector truly deserves the final spot. Let’s dive into the ultimate showdown: Multiples!
Extra Round: Deciding the Digitalization Champion
To pick our winner in Digitalization, we’ll analyze the four remaining sectors using multiples.
That said, comparing sectors with multiples is tricky. High multiples can signal strong performance, not just overvaluation, while low multiples aren’t always a bargain. So, while this helps guide our choice, it’s not foolproof.
Truth be told, we might not pick the absolute best candidate. But hey, not every talent show winner is the true star. Bias plays a role, and maybe the jury isn’t as sharp as he claims.
For a deeper dive into multiples, check out my co-author Cas’s piece, where he breaks down how to use multiples the right way.
Now back to the contest!
To get a balanced perspective, we’re relying on these three multiples:
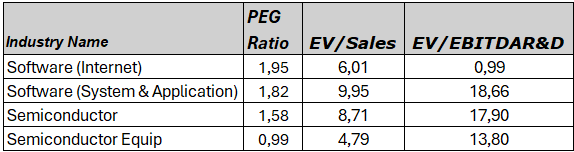
PEG Ratio (Price/Earnings to Growth) – All four sectors have high P/E ratios, which means investors are already pricing in strong future earnings. The PEG ratio helps us see whether this growth expectation is justified or if prices are stretched too far. A lower PEG suggests that growth isn’t fully priced in, making it a more attractive investment.
EV/Sales – This metric is particularly useful for software and semiconductor sectors, where companies often have strong revenue growth but varying profitability levels due to different cost structures. Since these industries rely heavily on scaling and market share expansion, EV/Sales provides a clearer view of how investors value each sector’s revenue potential, especially in high-growth markets.
EV/EBITDA (R&D Capitalized) – Traditional EBITDA metrics can be misleading in R&D-heavy industries like software and semiconductors, where significant spending on innovation is treated as an expense rather than an investment. By capitalizing R&D costs, this adjusted EV/EBITDA multiple gives us a better sense of each sector’s true profitability and operational efficiency.
Now, let’s see how our finalists stack up against these benchmarks:
And the Winner Is…
Semiconductor Equipment takes the crown! With the lowest PEG ratio (0.99) and EV/Sales (4.79), it offers strong earnings growth without excessive pricing. Its EV/EBITDA (13.80) also balances profitability and expansion better than the other Semiconductor segment, which appears overvalued.
Final Verdict: Our Three Sector Champions
After rigorous analysis, we have our three winners for each megatrend:
Aging Demographics: Healthcare Support Services
Sustainability: Environmental & Waste Services
Digitalization: Semiconductor Equipment
Of course, we acknowledge that this method isn’t foolproof. There’s no guarantee that these sectors will be the ultimate beneficiaries of future trends. Instead, our goal was to eliminate the riskiest sectors—those that destroy value, fail to grow, or appear overvalued.
By narrowing it down to three sectors, we can now move forward with qualitative research next week. The ultimate goal? Identifying one standout sector, from which we’ll select a company for an in-depth investment deep dive.
📌 Stay tuned for the final sector showdown! Don’t miss next week’s deep dive, where we’ll evaluate business models, competitive advantages, and market positioning to find the best company to invest in.
🔔 Want to stay ahead? Subscribe for updates and get exclusive insights into our top-down investing strategy.
💬 What do you think? Drop a comment below and let us know which sector you would have picked!
As promised, here’s the link to Damodaran’s dataset and our overview with key formulas!
link: https://pages.stern.nyu.edu/~adamodar/