


A Valuation Framework for Financial Institutions - Part III
The Assets

Last week, we dove into the income statement of J.P. Morgan, exploring the key figures that drive profitability. This week, we shift gears to look at the assets — and, perhaps even more importantly, the returns generated on those assets. The split between assets and liabilities is essential, as each has unique characteristics that are crucial to understanding the financial structure of institutions like J.P. Morgan. As we continue our real-life example of this banking giant, you'll see how these elements work together to provide a fuller picture of financial health. You know the drill by now: grab yourself a coffee, and enjoy this third part on valuating financial institutions.
The Basics
Assets are essential to every company. Remember: the assets are the cash-generators of a company. More profit with less assets implies that a company is more efficient. It’s also directly linked to the moat a company has. A bigger moat is reflected in more valuable assets, and vice versa. For a financial institution, a (simplified) balance sheet looks something like this:
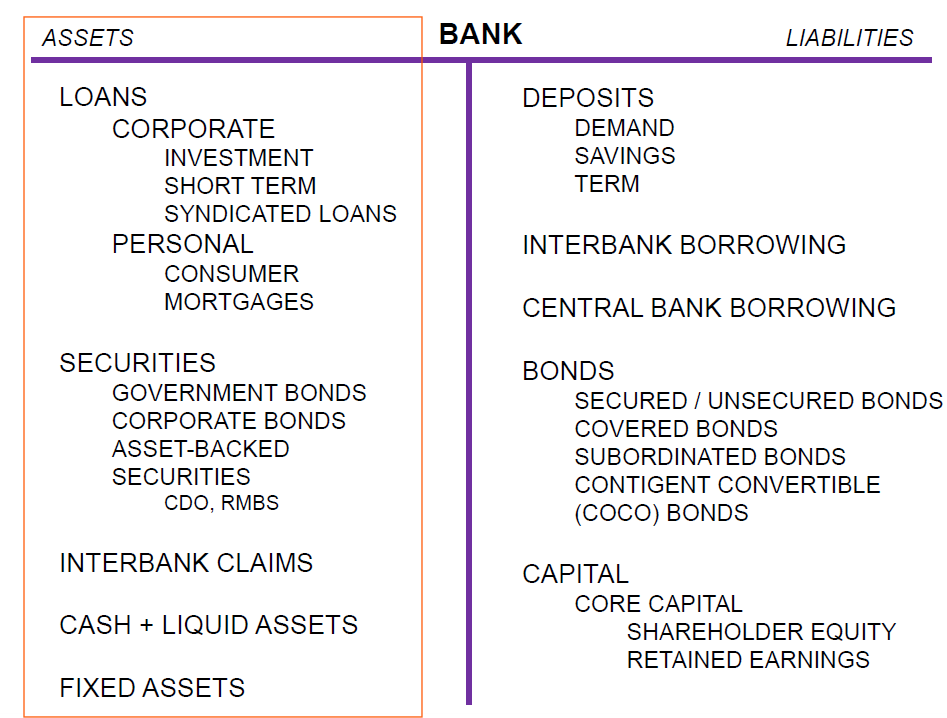
The usual suspects are present as always: Fixed Assets and Cash. Every public company, including banks, needs some cash and a building to operate from. Very basic. When looking at the securities, the government and corporate bonds also are pretty standard. In the securities segment, there are also the Asset-Backed Securities, a first indication of loans. These loans are considered safe enough to be put as securities because they are backed by assets. A well-known example of this type of loan is a Residential Mortgage-Backed Securities (RMBS).
Other types of loans are put somewhere else on the balance sheet, as part of the Loans section - bet you didn’t see that one coming. These are riskier loans, on which the Loan Loss Provisions (LLP) - that were discussed last week - are booked. Loans of a corporate nature and personal loans, such as consumer and non-residential mortgages, are put in this segment.
Lastly, there are also the Interbank Claims, a segment dedicated to loans going to other banks. You see, banks hold a lot of cash - like, really a lot. Sometimes - because deposits can be very volatile - banks have excess cash at the end of the day. Or, on the other hand, the cash flows out too quickly. The solution? A (short-term) loan to/from other banks, or a deposit on their account at the central bank. That’s right, like you and me have an account with a bank, the bank has an account at the central bank. As mentioned in Part II, banks can earn (pay) the so-called Overnight Bank Funding Rate (OBFR) by depositing (borrowing) money from the central bank. The mechanism of monetary policy? Largely based on this fundamental OBFR. The higher this rate, the more (less) interesting it becomes to deposit (borrow) at the central bank account. The result? Less cash to loan out to corporations and individuals, and a slowing economy. Currently, the fed put this rate at 4,33%. For comparison, this rate only amounted to 0,07% at the end of 2022…
Let’s take a look at a real-life example with J.P. Morgan:

I know it seems very different, but the biggest difference is in the names J.P.M gives to its assets… Let’s start with the first two lines: Cash and due from banks and Deposits with banks. There’s a slight difference between the maturity of these two, but in essence these are the Interbank Claims previously described.
Let’s jump first to the loans. The net loans make up around 1/3th of the balance sheet. This ratio can be considered as the Retail Orientation of a financial instiution. The higher this ratio, the more a bank tries to earn cash by giving out loans instead of turning to Non-Interest Expenses. This ratio also plays an important role in the risk-profile of a bank.
Lastly, there are also the investment securities. J.P.M splits them out a little bit more, but line 4 through 7 can all be considered as securities. At the bottom, the usual suspects are back. The last 4 lines all represent Fixed Assets.
Next, let’s turn to how efficiently these assets are used: measuring the returns…
Measuring Returns
A firm can earn millions of dollars, but this on its own tells an investor nothing. Did they do it by investing $1, or $1B? Important difference. Same goes for financial institutions.
Even for banks, the fundamental ratios Return on Assets (ROA) and Return on Equity (ROE) are the most important measures of efficiency. Let’s take a look at the measures provided by J.P. Morgan - ignore the other measures for now, these will certainly be discussed in a next part of this series:

The most fundamental rate - ROA - indicates that the bank has become more efficient over the last few years: raising the ROA from 0,98% to 1,43%. The ROA is influenced by three factors that were already discussed in the previous part: NII, NONINT and the cost-to-income ratio. It’s clear from the numbers that the ROA increases when the cost-to-income ratio decreases, a beautiful example of becoming more efficient.
Next, there’s also the ROE, indicating the returns generated on the bank’s own equity. Do you remember what connects the ROA and the ROE? That’s right: leverage.
ROE = ROA x Leverage
For J.P.M, the ROE = 1,43% x 12,3 ($4 002 814 / $324 708) = 17,6%. Rounding this becomes a ROE of 18%. Because of the nature of banks, they’re highly levered. The liabilities of a bank almost entirely exist out of other people’s money, with deposits being the biggest chunk. For those of you interested in all the factors that drive the ROE & ROA, I have left two overviews of the main drivers and how they can be calculated in the Appendix.
Before going to the closing remarks, I wanted to briefly focus on the concept of maturity transformation. I’ll highlight this further when talking about the risk-profiles and drivers of a bank, but the asset side plays an important part in it. More specifically, the type of loans a bank grands. I’ll try to illustrate with a simple scenario. Imagine this: a friend, Nick, comes to you and wants to borrow $10,000, paid back over 10 years, at a rate of 5%. This means you receive $1000 + interest back on a yearly basis. “Great,” you think, “I have a genius idea!”. Instead of paying this yourself, you borrow $10,000 from Marc-Junior, another friend, at an interest of 3%. One important caveat though: Marc-Junior can ask the full amount back at any point of time. If he feels like the 3% he earns isn’t enough anymore, he has the right to take it back at once, without any notice. Nick, on the other hand, only pays you back over the 10 coming years.
In the banking world, this is called maturity transformation. Banks use short-term funding to give out long-term loans. Managed badly, this can cause signficant outflows at one point in time, while only receiving smaller cash flows over a longer period. The short-term maturity of deposits is transformed into loans with long-term maturities.
Magic? Almost. Risky? Definitely.
Closing Remarks
And that’s a wrap on Part III! We peeked into J.P. Morgan’s vaults and discovered the lifeblood of banking: cash, bonds, loans and interbank claims, all working together to generate profit. We saw how every dollar of assets is put to work, driving ROA up from 0.98% to 1.43%, and how leverage magnifies those returns into an ROE near 18%. And we discovered about maturity transformation: the art (and risk) of borrowing short to lend long.
If you have some spare time, make sure to read our deep-dive on Givaudan.
See you for the next part!
Appendix


📢 Join the Conversation
Share your thoughts below—tell us which asset class surprised you most or pose a question, and let’s keep the conversation going!
🔔 Stay Updated
Subscribe now to get each new installment delivered weekly.
Please note: This article includes a disclaimer regarding investment advice.
Our Recent Posts


Who Deserves the Deep Dive? You Tell Us

Last week, together with Ozeco, we dove into the world of ingredient companies. Yes, I know — that sounds painfully boring. But hear me out.