


Melexis - Part IV
The Story in Numbers (Continued)

In Part IV, let's take a look at the income statement together and uncover some important points! We'll start by focusing on two things: (1) the gross margin and (2) spending on research and development (R&D). After all, who doesn't love a good growth story?
To get a broader perspective, we'll also look at EBIT margins (earnings before interest and taxes), how they grow, and how this leads to NOPLAT (Net Operating Profit After Taxes). That might sound complicated, but it's really just a smart way to see how well a company is performing!
Vertical Integration at Melexis
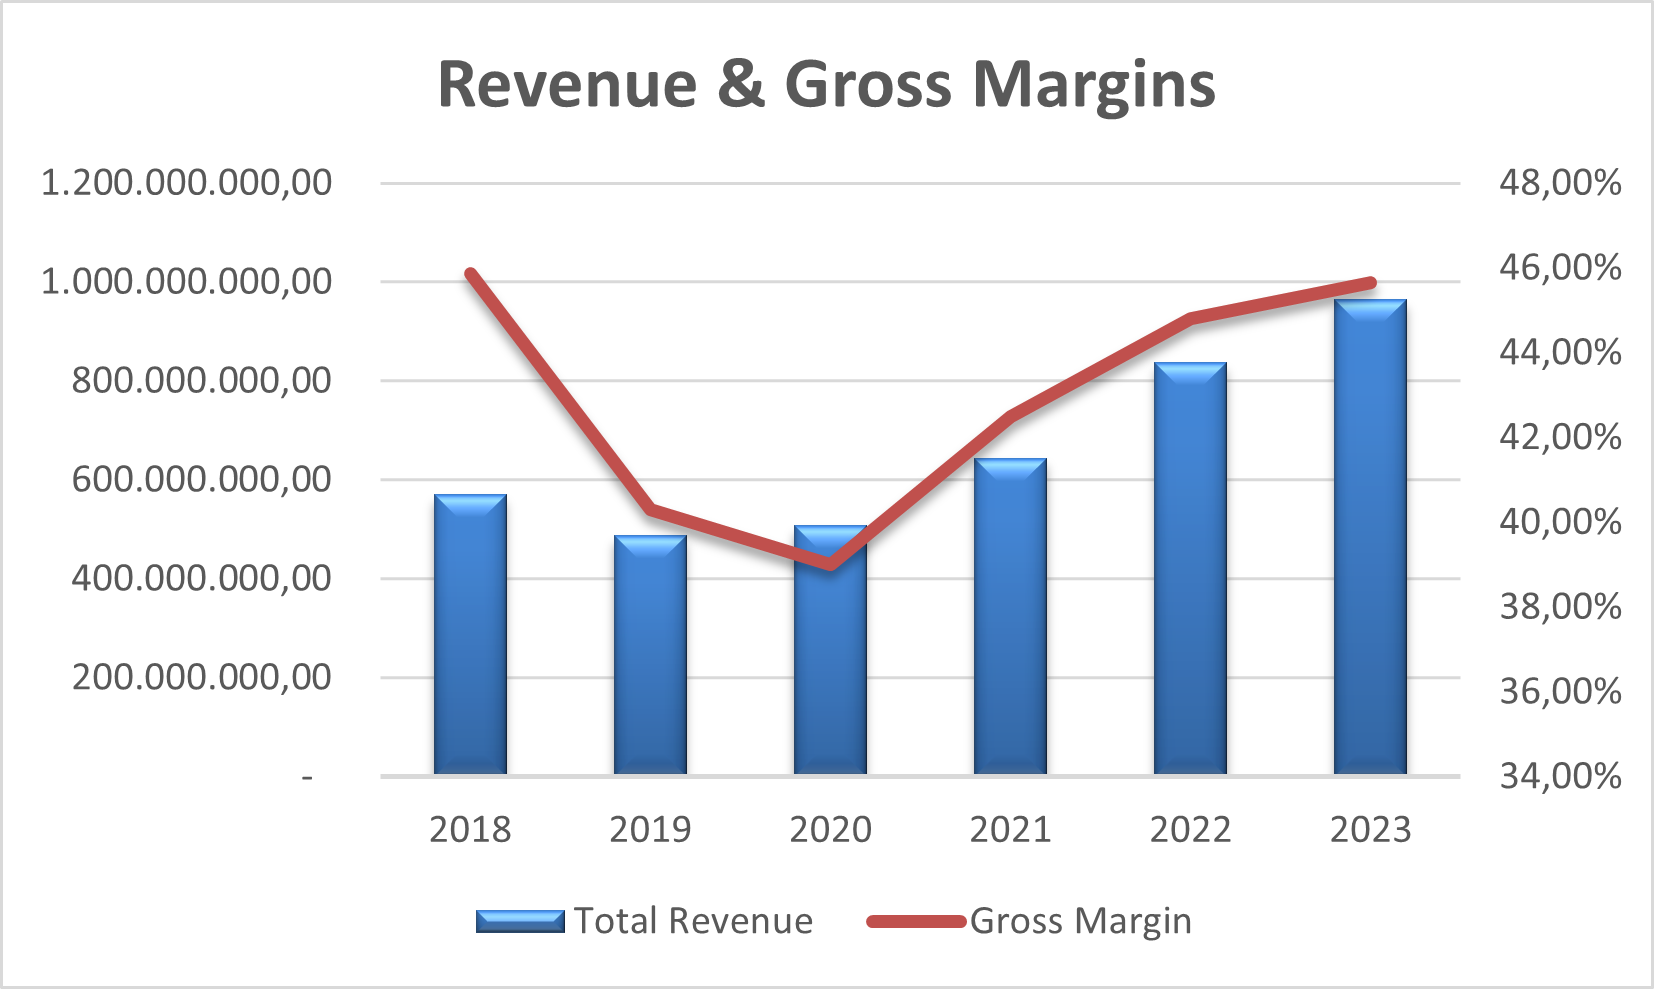
Let’s talk Melexis and their 2024 gross margin of 44.21%. Sure, it’s a bit shy of the semiconductor industry average of 59%, but wait—there’s more to the story. Melexis uses a vertical integration model with external manufacturing, so it’s not fair to compare them to factory-owning giants. Instead, let’s look at fabless firms like Qualcomm and Marvell Technology Group (MTG).
Qualcomm, the U.S. superstar, flexes a juicy 56.4% gross margin, while MTG, with 43% of revenues from Asia, lands at 45.8%. Melexis is right in MTG’s ballpark but lags behind Qualcomm. Why? Well, Qualcomm’s massive $39 billion revenue likely gives them strong leverage over suppliers, while MTG’s $5.5 billion is closer to Melexis’ scale, making their numbers more relatable. Still, despite these comparisons, it seems Melexis’ vertical integration isn’t delivering the competitive edge we expected. Intriguing, right??
Zooming out, Melexis has been climbing steadily since 2019, except for a quick stumble in 2020, reaching a gross margin of 45.65% by 2023. Revenue? Oh, it’s been growing like a champ—11% annually since 2018, beating many competitors. For example, Qualcomm saw a 12% revenue dip from FY 2022 to FY 2024, and MTG dropped 7% from FY 2023 to FY 2024 (though they had a wild 32% boost the year before).
Bottom line? Melexis is steadily growing revenue and bouncing back on margins, proving they’ve got the stamina to stay in the game—and that’s no small feat in the ever-shifting world of semiconductors! For the visual people, a graphical representation:
Innovation at Melexis
Now let’s dive into another key strength of Melexis: innovation. It’s their secret sauce for staying ahead of the competition and a major selling point for investors. They achieve this by (1) focusing on cutting-edge chip design and (2) recruiting top-notch talent.
The first point is a perfect fit for their fabless business model, letting them concentrate on improving chip designs without the distraction of running factories. Done right, this can lead to (1) higher revenues from better products or (2) reduced costs as chips become more efficient and easier to produce. Either way, R&D spending is essentially an investment that should pay off in the future with higher revenues or increased operational profits.
The second point—talent—is trickier to measure. Sure, we can track how many people joined Melexis in 2023, but quantifying their skills? That’s another story. Instead, we’ll focus on the growth of revenues and NOPLAT (Net Operating Profit Less Adjusted Taxes) compared to R&D investments. Makes sense, right?
Here’s the plan: we’ll analyze how much growth in NOPLAT comes from every euro spent on R&D. This "ROI for R&D" gives us a snapshot of how effective Melexis’ innovation spending really is. Considering R&D is a major expense in this sector (13.7% of revenues for Melexis vs. 18.21% industry average), it’s a crucial driver of growth—or a potential stumbling block.
Let’s look at the data:
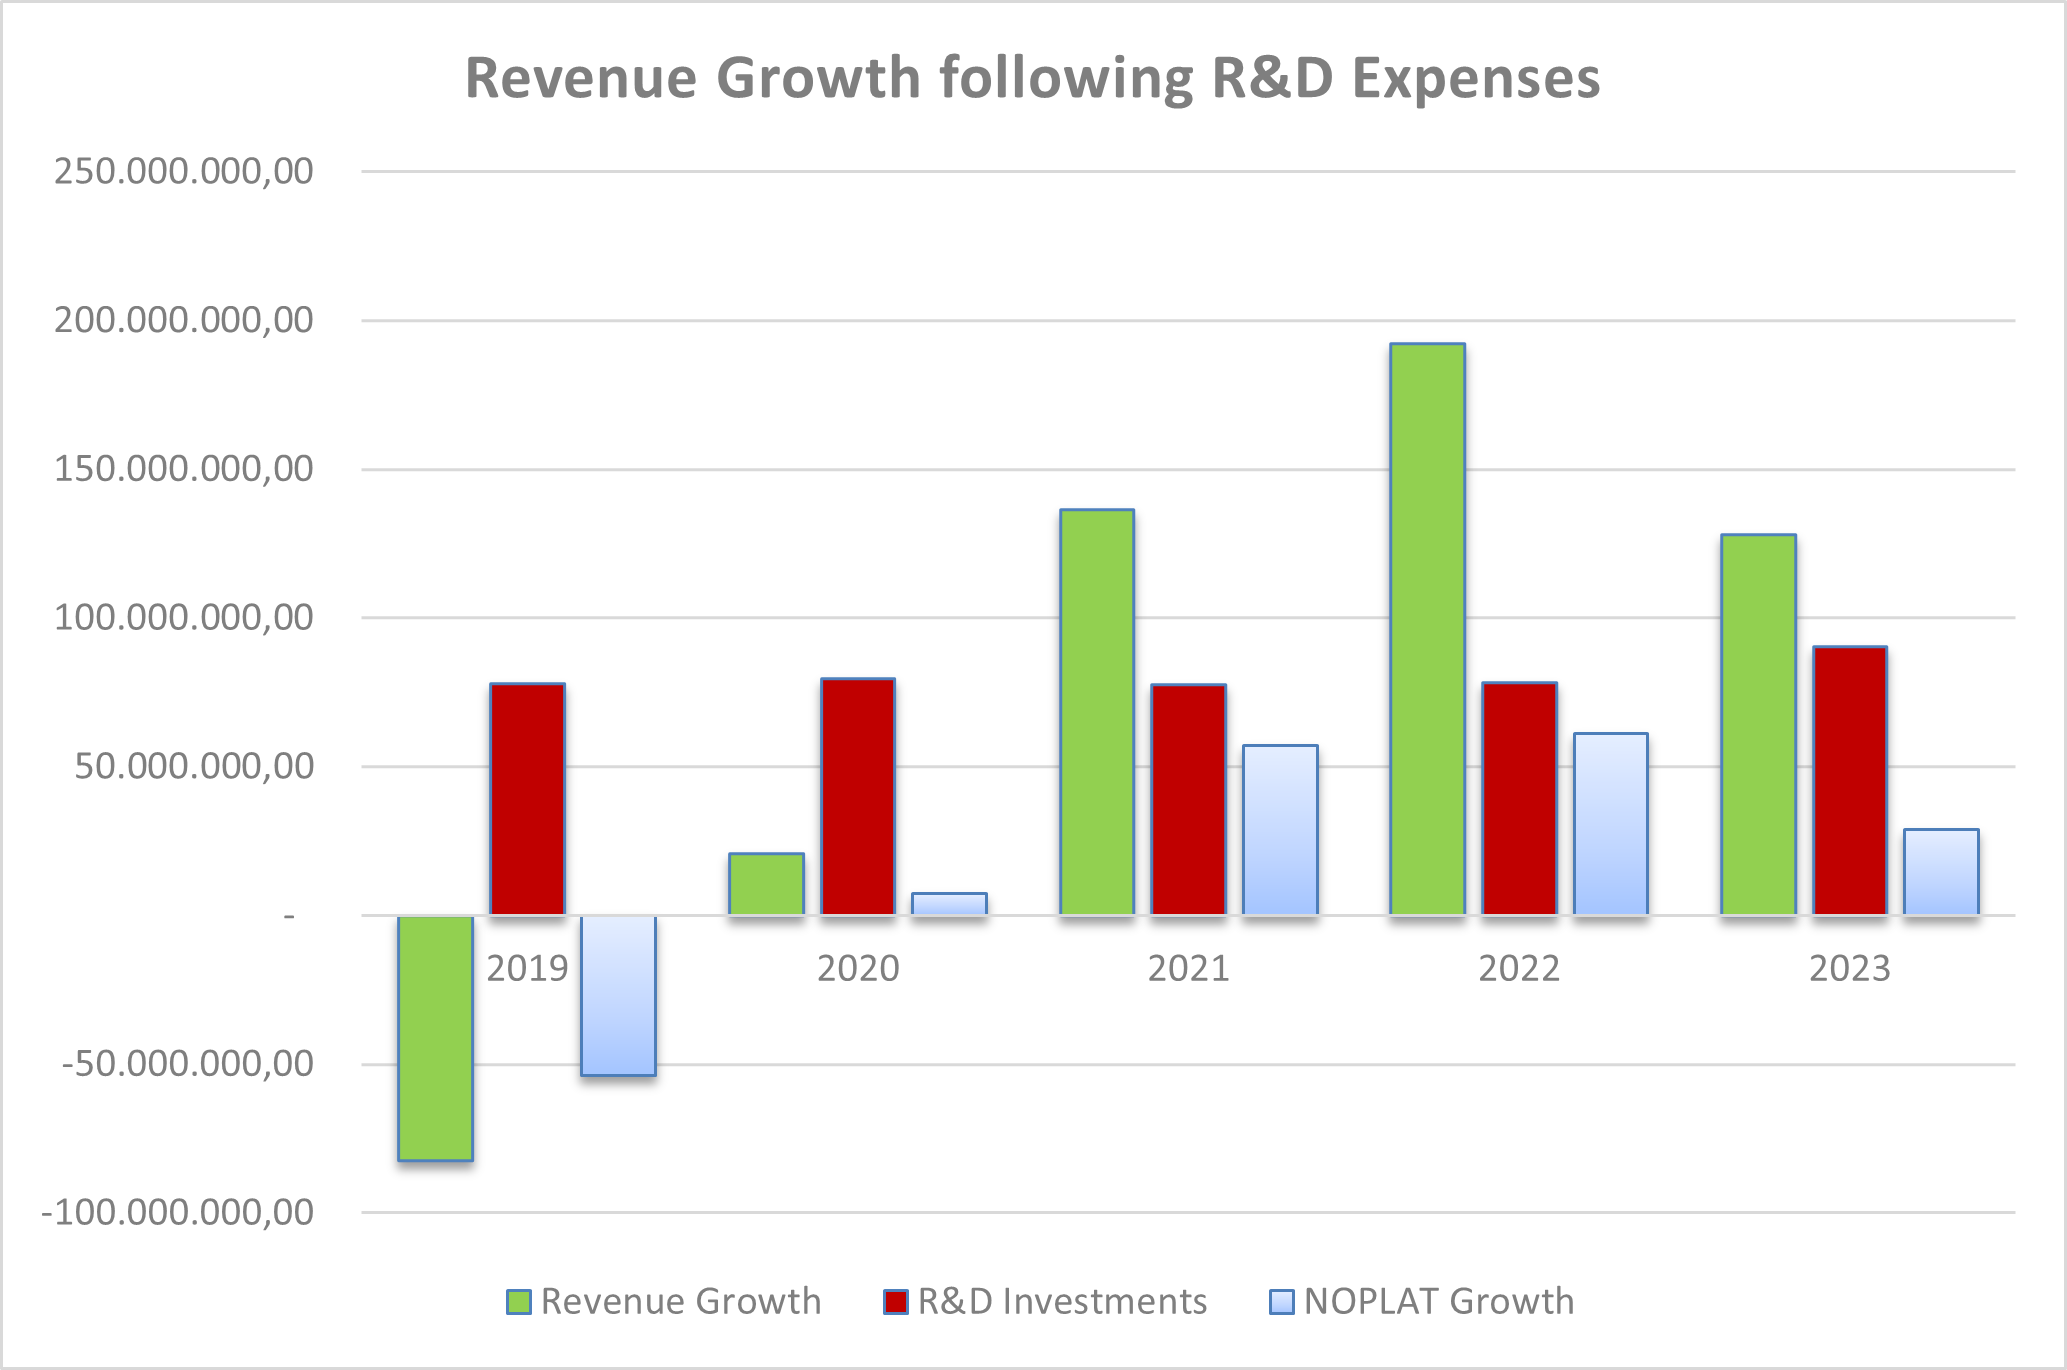
Excluding the tough year of 2019, R&D investments and growth have consistently gone hand in hand. Over five years, Melexis has averaged a 24.82% ROI on R&D. Remove 2019 from the equation, and that figure jumps to an impressive 48.26%. Translation? Every euro spent on R&D brought back 48 cents in operational profit—a solid return! While it’s impossible to credit R&D alone for this success (other factors such as market recovery play a role too), it’s clear R&D is a key value driver for Melexis. This strongly suggests their team knows what they’re doing and will continue creating value down the line.
All in all, Melexis’ commitment to innovation checks out. They’re leveraging smart R&D spending and a capable team to fuel growth, keeping their competitive edge razor-sharp. Bravo!
Operational Efficiency
Let’s continue by checking out how profitable Melexis’ operations are. Since 2019, their EBIT margins have been on the rise, hitting 26.27% in Q2 FY 2024 and even surpassing their pre-COVID level of 24.32%. The semiconductor industry average for operating margin stands at 29.71%, so while Melexis hasn’t quite caught up, they’re closing the gap—and here’s why that’s impressive.
The gross margin (determined by the cost of revenue) is where Melexis lags behind, meaning they face higher production costs than competitors. However, the magic lies in their operational expenses—the costs between gross profit and operating profit (think sales commissions, depreciation, admin costs, etc.). Melexis keeps these costs remarkably low, which helps their operating margins approach the industry average despite their higher production costs. That’s what we call efficiency! It’s a big win for returns and signals smart expense management.
Check out this trend in Graph III:
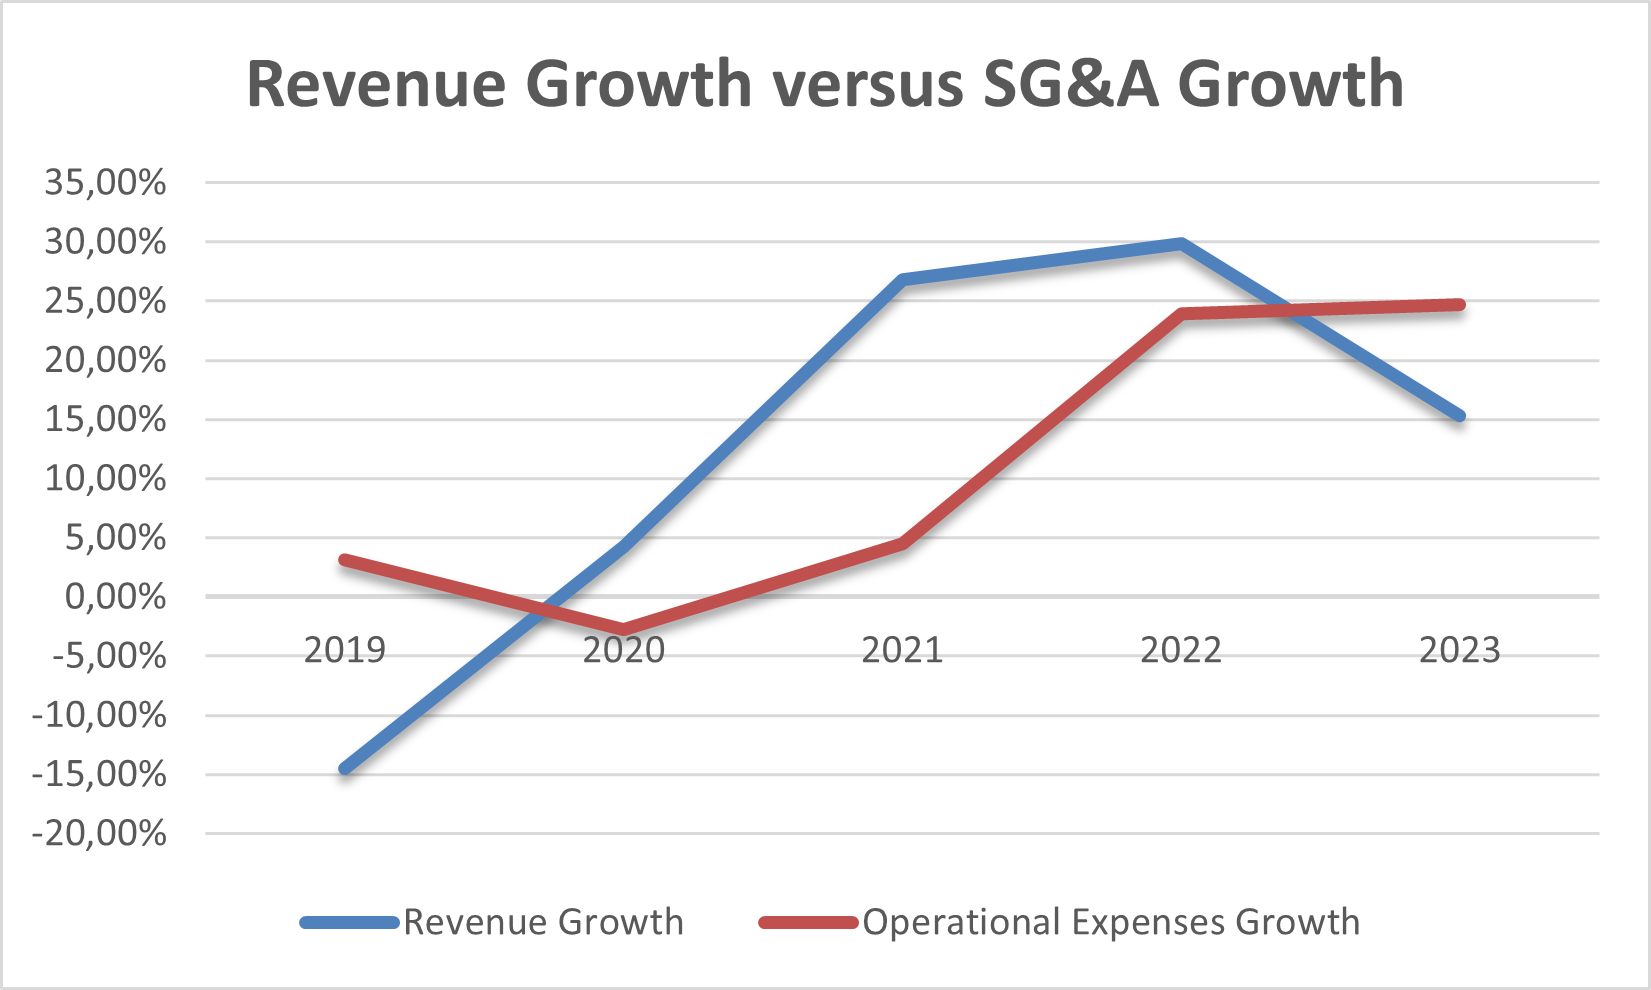
In simple terms, the red line (operational expenses) needs to stay below the blue line (revenue growth). And for the most part, it does. Barring 2019 and the last year, Melexis has consistently grown revenue faster than expenses. This year’s hiccup could just be a one-time slip, but it’s something to keep an eye on. It doesn’t spell doom, but investors should stay vigilant.
Oh, and one more thing—R&D expenses aren’t included in this graph. We treat those as capital expenditures since they pay off down the line. That means the "adjusted" operating margin would actually be higher, but we’ll save that discussion for another day. The key takeaway? Melexis has been managing its operational efficiency like a pro, pushing their margins above pre-COVID levels. That’s a solid indicator of operational strength and a promising sign for the future.
Reinvesting In The Future
No company can grow without investing—it’s just a fact of life. In theory, companies only take on projects (fancy word for “investments”) that promise returns above a certain threshold. Sounds sensible, right? But here’s the catch: estimating those returns is tricky, and having the discipline to follow through? Even trickier. Some managers, driven by short-term rewards or personal glory, might fall for “prestige projects.” Think of them as corporate vanity exercises: flashy green initiatives or massive HQs that don’t quite pay the bills but sure look good on the company brochure.
The basic idea seems straightforward: first, generate cash from your operations (“cash from operating activities”), then invest in growth projects (“cash from investing activities”). Whatever’s left can go to pay off loans, reward investors with dividends or buybacks, or sit in reserve for rainy days. Easy, right? Not so fast. The real world is full of uncertainties, and this is where managers earn their keep—deciding which projects are worth the plunge. The brilliance (or not) of these decisions is captured in the Return on Invested Capital (ROIC), a measure of how efficiently a company turns investments into profits.
ROIC is simple enough to calculate:
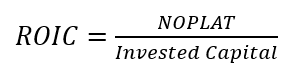
Where:
NOPLAT = Net Operating Profit Less Adjusted Taxes (fancy speak for after-tax operating profits).
Invested Capital = Total Equity + Debt - Non-Operational Assets (like cash or goodwill).
Let’s simplify: for Melexis, we assume the only non-operational asset is cash. So, our formula for Invested Capital boils down to:

And hey, Milan already did the heavy lifting on the Net Debt numbers (thanks, Milan!). So with some quick math, Melexis clocked an impressive ROIC of 31% for 2023. That means for every euro invested, they generated 31 cents in profit—well above the semiconductor industry average of 21%. Hats off to management for stellar capital allocation!
So far, so good: they’re making smart investments. But how much are they investing? Imagine finding the world’s best project but only investing pocket change. Sure, you’d get a killer ROIC, but your growth would be…meh. That’s why we need the Reinvestment Rate (RR):
Here’s how reinvestments are calculated:

CapEx: Money spent on long-term assets like factories or equipment.
D&A: Depreciation and amortization, a non-cash charge we add back.
Change in Working Capital: While the balance sheet provides a useful snapshot, we’re focusing on cash flows here. An increase implies a decrease in cash and vice versa.
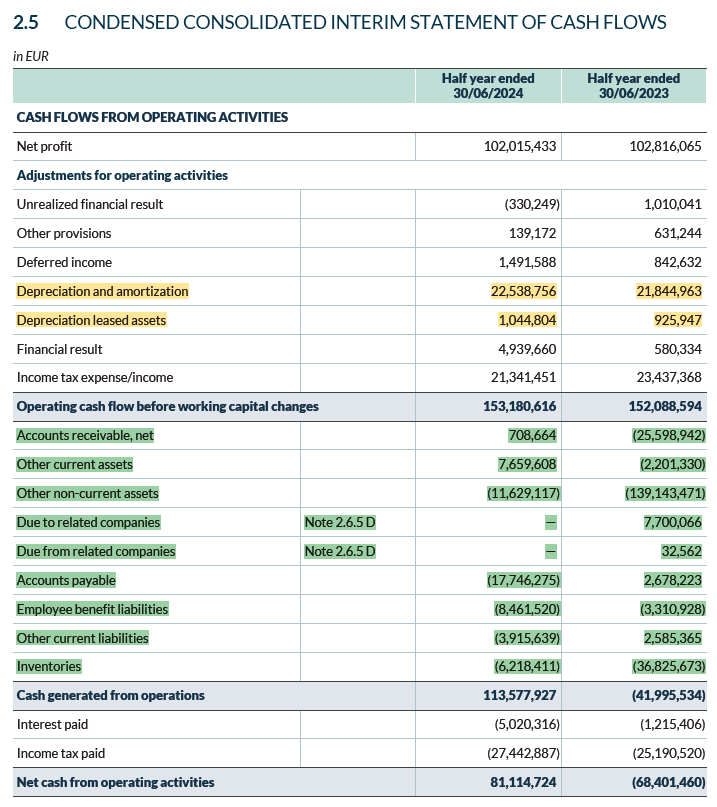
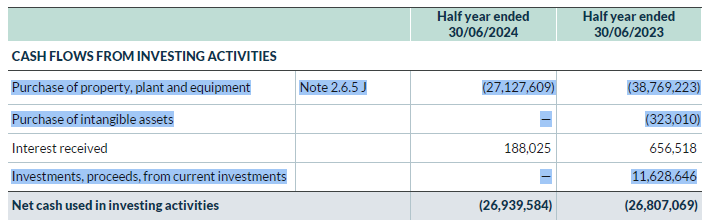
For H1 2024, Melexis’ reinvestments were €43M, giving a reinvestment rate of 40.73%. The industry average? Around 46.25%. Over the past five years, their reinvestments have swung wildly, from -€20M (a rough 2019) to €290M in 2023 (thanks to a one-time LTA with X-Fab). This volatility shows why reinvestment measures need context—always ask why they vary.
Finally, we calculate the fundamental growth rate:

For 2023, with a normalized reinvestment rate, this works out to:
51% × 31% = 15.81%
If that growth materializes, it’d push revenues toward €1.1B. Ambitious? Yes, especially since Melexis revised its revenue forecast to €940M. But the point isn’t to be precise to the decimal—it’s to test your assumptions. What happens if margins shift? What if reinvestments change? This approach makes you think, tweak, and get closer to the truth.
Final Remarks
In conclusion, Melexis presents a mixed but compelling narrative of steady growth, strategic focus, and ongoing challenges. While the company has demonstrated resilience and a strong commitment to innovation, its performance reveals areas for both optimism and caution.
On the positive side, Melexis has effectively utilized its fabless business model to concentrate on cutting-edge chip designs, driving consistent revenue growth and achieving competitive returns on R&D investments. Operationally, their ability to manage expenses and maintain rising EBIT margins highlights a commendable focus on efficiency, particularly in a competitive and high-cost industry like semiconductors.
However, the company faces some serious challenges. Its gross margin still lags behind industry leaders, raising questions about the effectiveness of its vertical integration strategy compared to peers like Qualcomm or Marvell Technology Group. While Melexis has outpaced many competitors in revenue growth, the industry’s volatility and the company’s variable reinvestment rates indicate that sustaining this momentum will require careful strategic execution.
The outlook for Melexis is promising but not without risk. Much will depend on how well the company continues to balance its innovation efforts, operational efficiency, and reinvestment strategy amid an ever-changing market landscape.
To build on this analysis, a detailed valuation—based on the assumptions and insights explored here and in prior articles—will be released either on Sunday or Wednesday. This will (hopefully) provide a clearer picture of Melexis’ long-term potential. Stay tuned!
Please note: This article includes a disclaimer regarding investment advice.
Source for Industry Averages: https://pages.stern.nyu.edu/~adamodar/New_Home_Page/data.html
Other Posts You Might Like:
Melexis - Part III

In our ongoing exploration of Melexis, we've already taken significant steps to understand this fascinating company. In Part 1, we explored what Melexis does, focusing on qualitative assessments to better grasp its position in the market. Then, in Part 2
Melexis - Part II

Welcome back! Last time, we explored the compelling story of Melexis—a tale that, at first glance, seemed almost too good to be true. But as with any story, there’s another side worth examining—the risks. That’s exactly what we’re diving into today. In this shorter follow-up, we’ll unpack four key risks facing Melexis:
Melexis: A Qualitative Analysis

As we dive into 2025, it’s time for another deep dive into the business world. Don’t worry—we promise not to churn out yet another “Top 20 Stocks to Buy in 2025” list (at least not this year… but hey, who knows what we’ll do if we’re desperate for clicks and shares next time). Instead, today’s focus is on a company that hits close to home—literally. Mee…
Decoding Financial Statements

Merry Christmas and Happy New Year, everyone! 🎉 Can you believe we’ve been hanging out on this platform for almost four months now? Time really does fly when you’re having fun! With the holidays still in full swing—and let’s be honest, many of us still recovering from those big Christmas dinners—we thought we’d handle a more fundamental topic.